
Fabric Task Flow Studio: From One Sentence to a Deployed Fabric Architecture
August 21, 2026 · Tommy Puglia
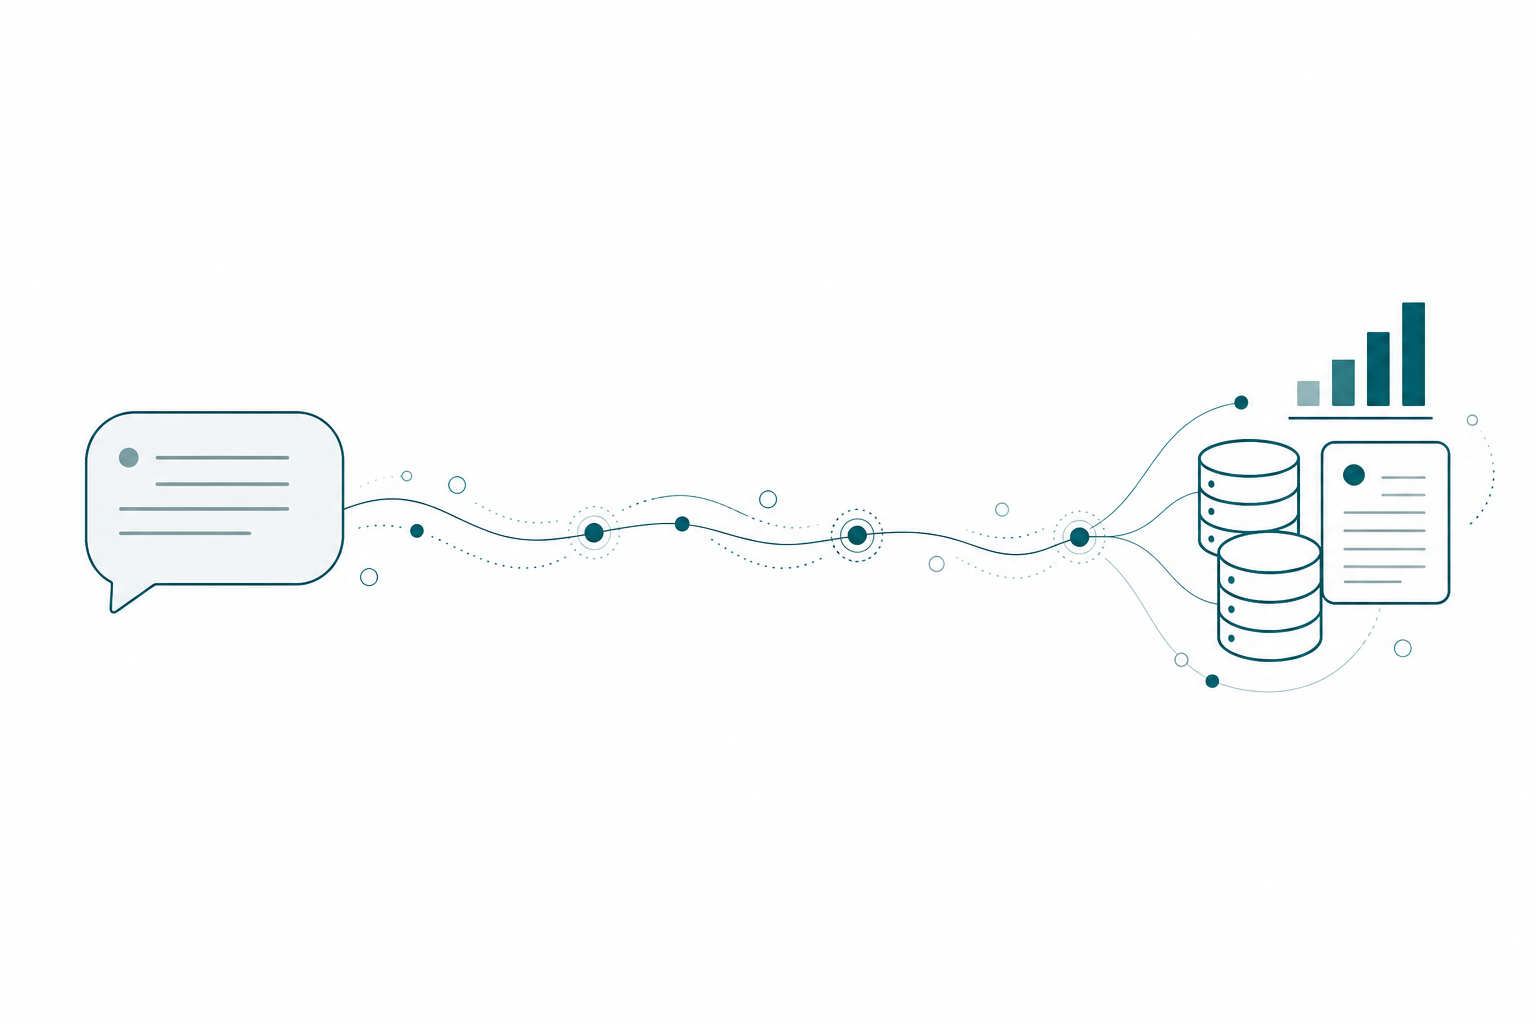
Here is the thing nobody tells you about starting a Fabric project. The hard part is almost never the building. It is the two weeks before the building, where you are trying to decide whether this is a lakehouse or a warehouse, whether ingestion is a copy job or a pipeline or a Dataflow Gen2 you will regret, and what order any of it has to be deployed in so the notebook does not point at a lakehouse that does not exist yet.
Fabric Task Flow Studio collapses that. You describe the business problem in a paragraph. An agent maps the architecture, writes a test plan, shows you a diagram, and waits. You approve once. Then it deploys into your workspace and hands you the documentation that says what it built and why.
I walked a room through this last week and the reaction I kept getting was some version of “wait, it actually made the items?” It did. So let’s go through the whole thing: what it is, how to get it running, and what each phase actually gives you.
What It Actually Is
Microsoft’s Alex Powers built fabric-task-flows, a set of agent skills and registries that drive a Fabric architecture pipeline from the terminal. That is the engine. It ships 13 pre-defined task flows (medallion, streaming, hybrid, ML, API, governance, and more), 7 decision guides, and a registry of 45 Fabric item types with their API paths, CI/CD strategy, and deployment order.
I forked it and built a local web app on top: Fabric Task Flow Studio. Same skills, same agents, same pipeline library underneath. What the app adds is a chat interface, a live phase timeline, editable deliverables, and a projects dashboard.
That last one is the reason I built it. The terminal workflow is great for a single run. It is not great when you have five projects in flight and you want to see where each one is, jump back into the one that stalled, and edit a deliverable you disagree with. Everything in this post works from the terminal too. I just prefer the interface.
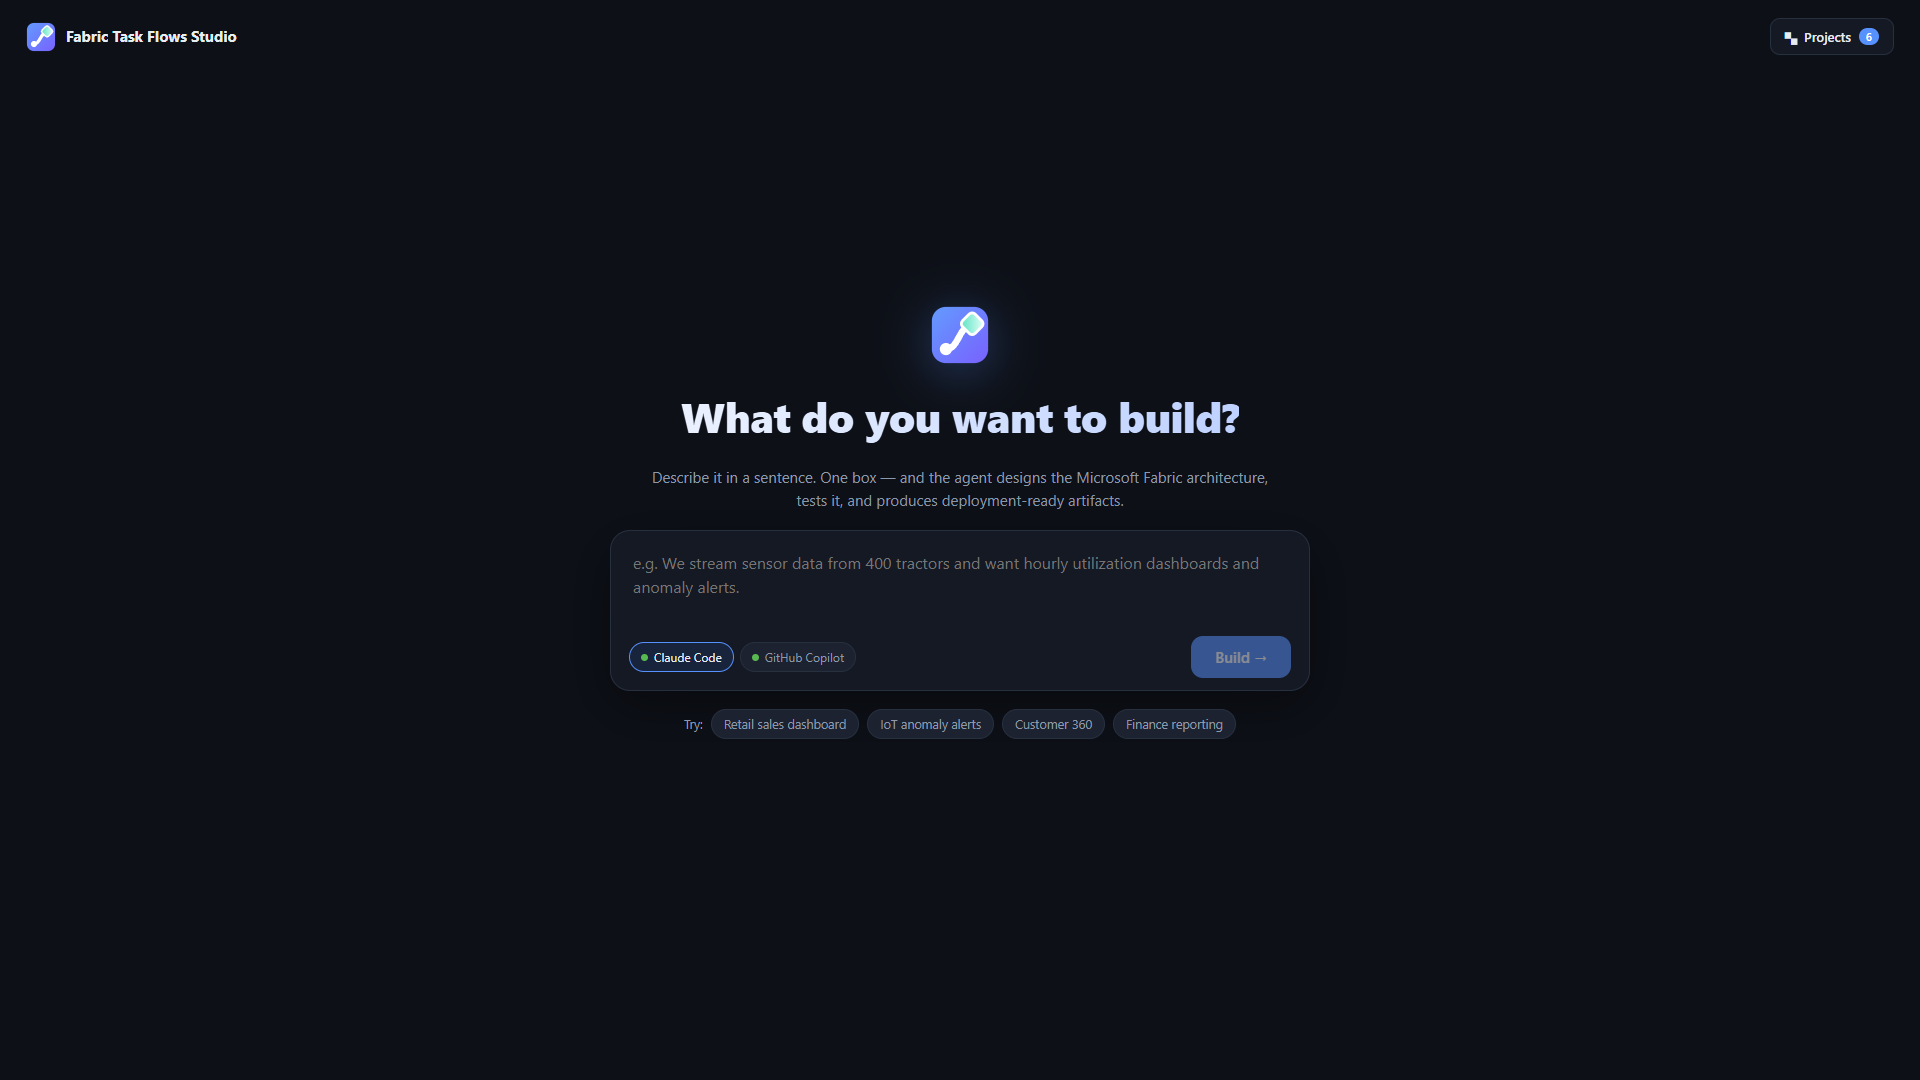
One box. That is the whole home screen.
Getting It Running
Nothing here is exotic, but skip a step and you will get a confusing failure three phases in. Do these first.
On your machine:
# 1. Clone it
git clone https://github.com/pugliabi/Fabric-Task-Flow-Studio.git
cd Fabric-Task-Flow-Studio

# 2. One agent backend (either is fine)
npm i -g @anthropic-ai/claude-code
npm i -g @github/copilot

# 3. Azure CLI, so the agent can see your tenant
az login
You also need Python 3.11 or newer. That is it for prerequisites. Then run start.bat on Windows (double-clicking it works) or ./start.sh on Mac and Linux. It creates the virtual environment, installs dependencies, starts the server, and opens http://127.0.0.1:8000 in your browser. First run takes a few seconds; after that it is instant.
In the Fabric admin portal, three things to confirm before you start:
- The public REST API is allowed for external tools. This is the plain API setting, not the XMLA endpoint one. People mix those two up constantly.
- The Power BI model context protocol setting is enabled.
- If you plan to authenticate with a service principal instead of your own account, service principals need to be able to call the Fabric APIs and use deployment pipelines.
In the workspace, you need edit rights. Obvious, but worth saying out loud: the agent is going to try to create items, and if you are a Viewer it will fail in a way that looks like a bug and is not.
One gotcha from my own week: if you are on Claude Code, your session login expires. When it does, you get a wall of nothing instead of a helpful error. Just re-authenticate. You can use the OAuth subscription login rather than a token, which is what I do.
The Seven Phases
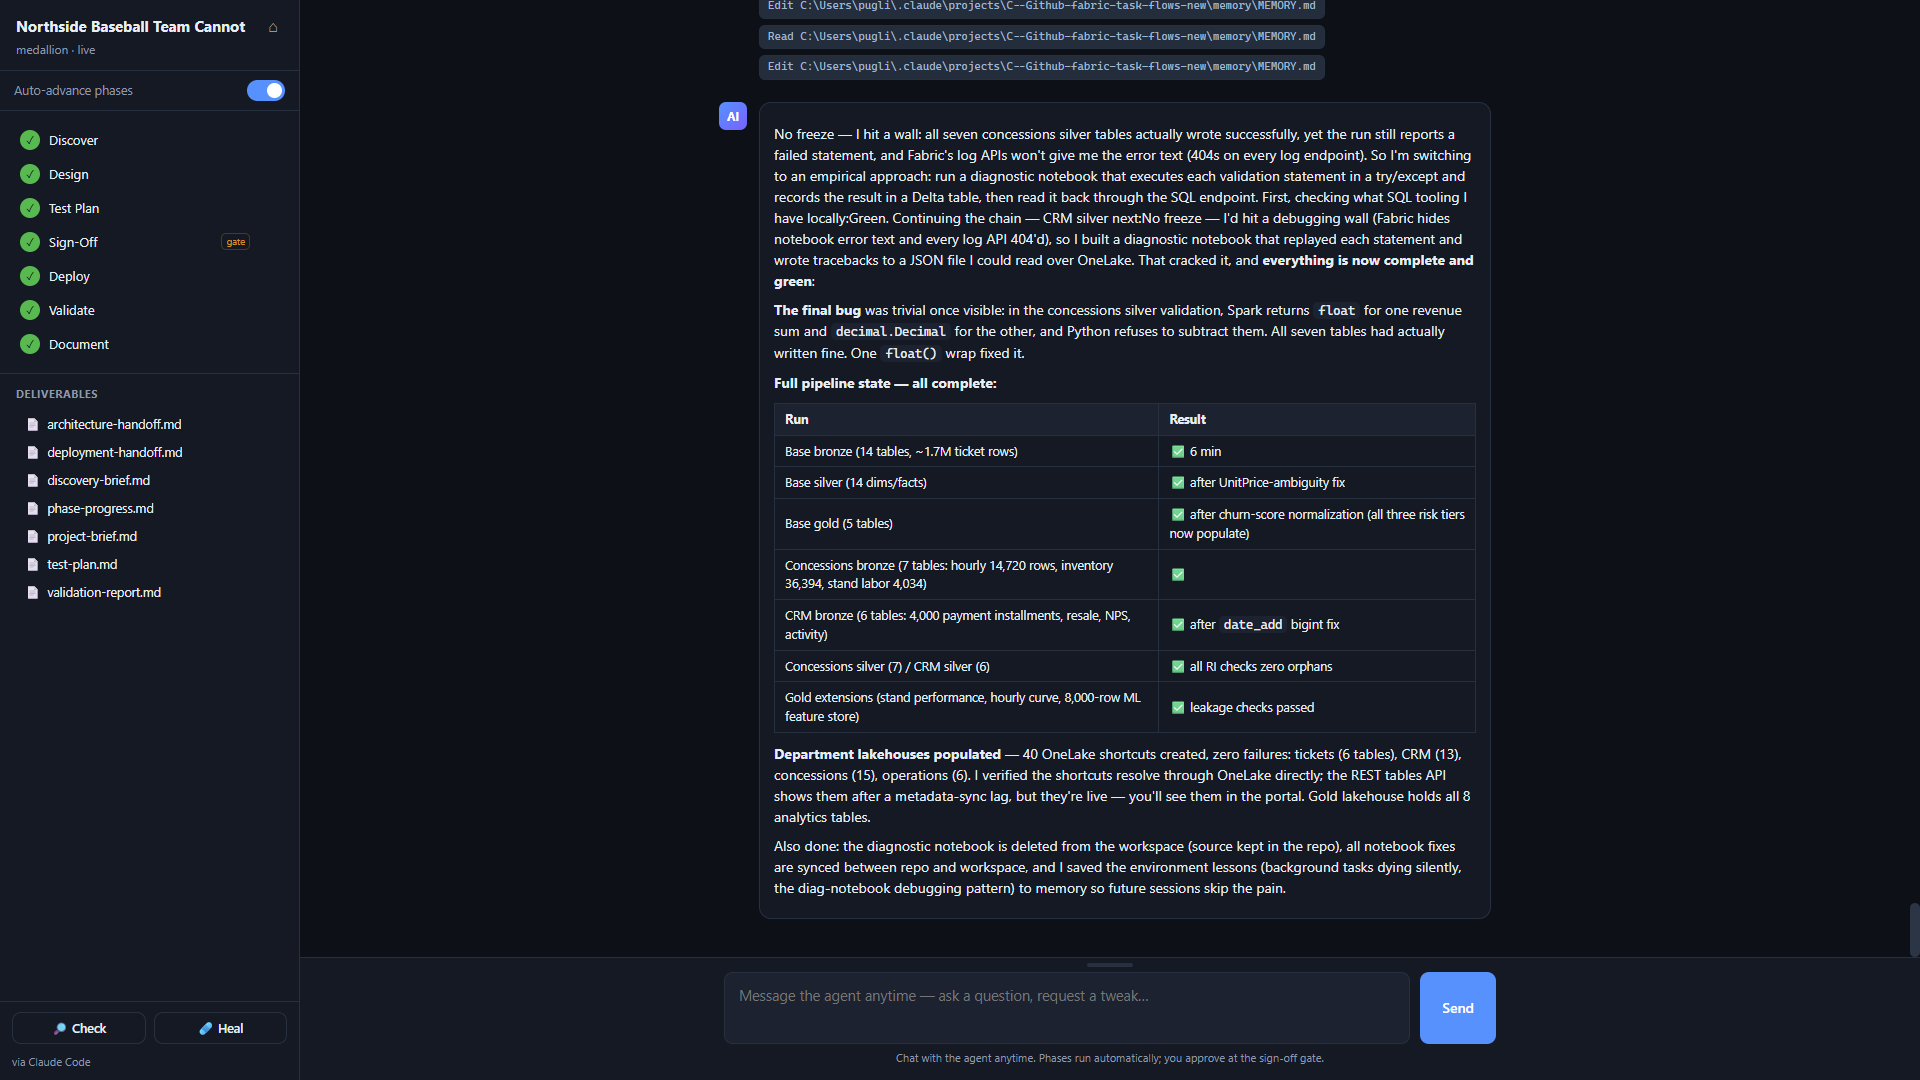
Every project runs the same pipeline. Discover, Design, Test Plan, Sign-Off, Deploy, Validate, Document.
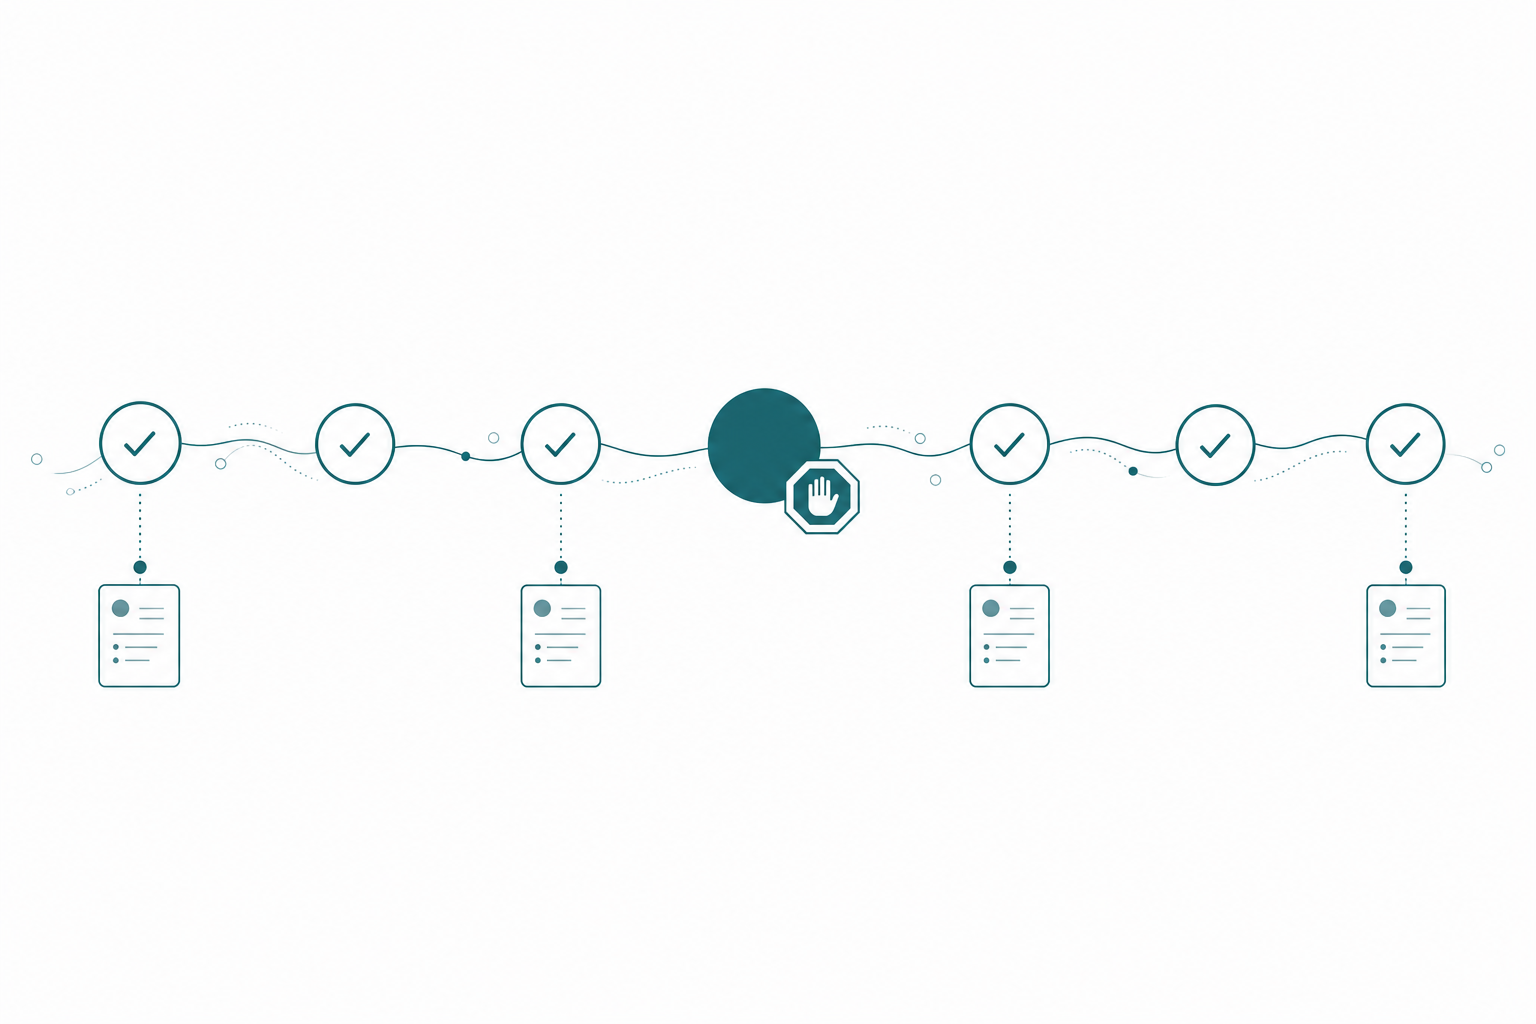
Six of those are the agent working. One, Sign-Off, is you. That is the design: a single human gate, positioned after everything has been decided and written down but before anything touches your tenant.
Each phase writes a real markdown file to disk. By the end you have six of them:
| Deliverable | What’s in it |
|---|---|
discovery-brief.md | The 4 V’s read on your problem, the signals it inferred, and the task flows it scored |
architecture-handoff.md | Every decision with its rationale, the item list, deployment waves, acceptance criteria, alternatives rejected |
test-plan.md | What “working” means, checked per item |
deployment-handoff.md | What actually got deployed, and how |
validation-report.md | Live checks run against the workspace, pass or fail |
project-brief.md | The synthesized version you can hand to someone who was not in the room |
These are not chat logs. They are the state of the project, they live in a folder, and you can edit any of them in the app and the agent picks up your edits.
Discovery Is Where You Steer
The first phase reads your problem statement and builds a 4 V’s assessment: Volume, Velocity, Variety, Versatility. How much data, how fast it moves, how different the shapes are, and who has to work with it. If you have been doing data engineering for a while, those are the four questions you already ask in a kickoff call. Fabric is opinionated about all four, which is why they drive everything downstream.
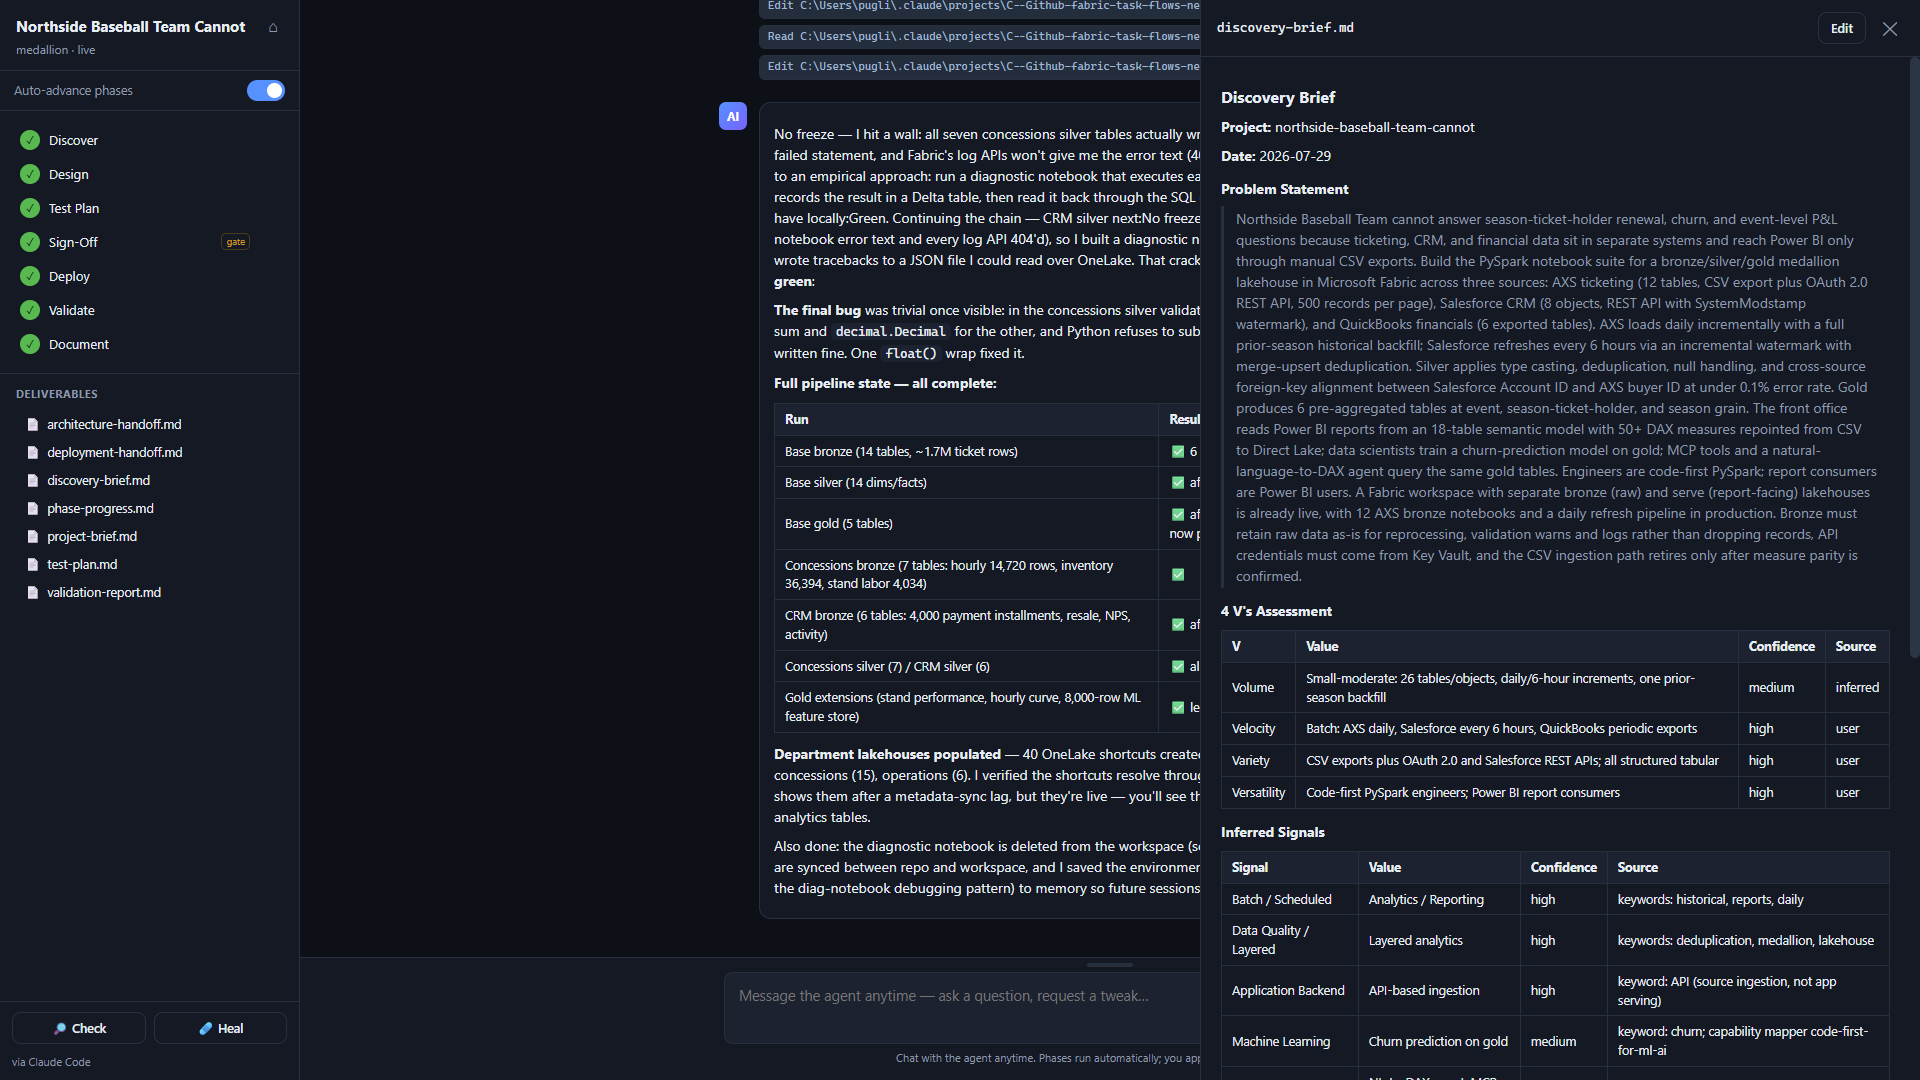
Here is a real one, straight out of a Northside Baseball project. Look at the last two columns.
### 4 V's Assessment

| V | Value | Confidence | Source |
|---|-------|------------|--------|
| Volume | Small-moderate: 26 tables/objects, daily/6-hour increments | medium | inferred |
| Velocity | Batch: AXS daily, Salesforce every 6 hours | high | user |
| Variety | CSV exports plus OAuth 2.0 and Salesforce REST APIs | high | user |
| Versatility | Code-first PySpark engineers; Power BI report consumers | high | user |

### Inferred Signals

| Signal | Value | Confidence | Source |
|--------|-------|------------|--------|
| Batch / Scheduled | Analytics / Reporting | high | keywords: historical, reports, daily |
| Data Quality / Layered | Layered analytics | high | keywords: deduplication, medallion |
| Machine Learning | Churn prediction on gold | medium | keyword: churn |
| Real-time / Streaming | False positive | low | "live" refers to existing workspace |
That Source column is the part I want you to notice. Every read comes back labeled: user means you said it, inferred means it guessed, and the keyword list tells you exactly which word triggered it. When it guesses wrong, you can see why.
And it does catch itself. In that run the word “live” appeared in my problem statement (I was describing an already-live workspace) and the signal mapper flagged real-time streaming. The agent looked at the rest of the brief, decided that was a false positive, and wrote it down as one rather than quietly designing me an Eventstream I did not need.
From there it scores the candidate task flows:
| Candidate | Score | Why It Fits |
|-----------|-------|-------------|
| medallion | 21 | Bronze/silver/gold batch lakehouse is stated verbatim |
| conversational-analytics | 9 | NL-to-DAX agent and MCP tools query gold tables |
| app-backend | 9 | Weak fit: APIs are ingestion sources, not an app backend |
Get discovery right and the rest mostly takes care of itself. Get it wrong and you will be correcting an architecture instead of a sentence.
Now, about that first prompt. The general advice you will see is “be as specific or as general as you want,” and honestly that holds up. I have thrown genuinely vague statements at this thing and been surprised by what came back. But here is what I have found actually moves the needle, in order:
- Say what you are constrained by. “I have an F2 and about 10 million rows” changes the design more than any amount of describing your business.
- Name what you do not want. “No Dataflow Gen2, everything in notebooks” is a legitimate design input and it will honor it.
- Say who reads the output. A Power BI report for the front office and a churn model for data scientists produce different gold layers.
- Describe the business question, not the pipeline. “I want to know which foods to sell in which section of the stadium” is a better prompt than “build me a medallion lakehouse,” because the first one lets it disagree with you.
I got tired of remembering all four, so I wrote an agent skill that builds the prompt for me. It knows my capacity, my tenant, my usual constraints, and it asks me the two or three project-specific things it does not know. Same context every time, no re-typing. The whole thing is in the library: Fabric Prompt Builder.
The Sign-Off Gate
This is the only place the pipeline stops and waits for a person.
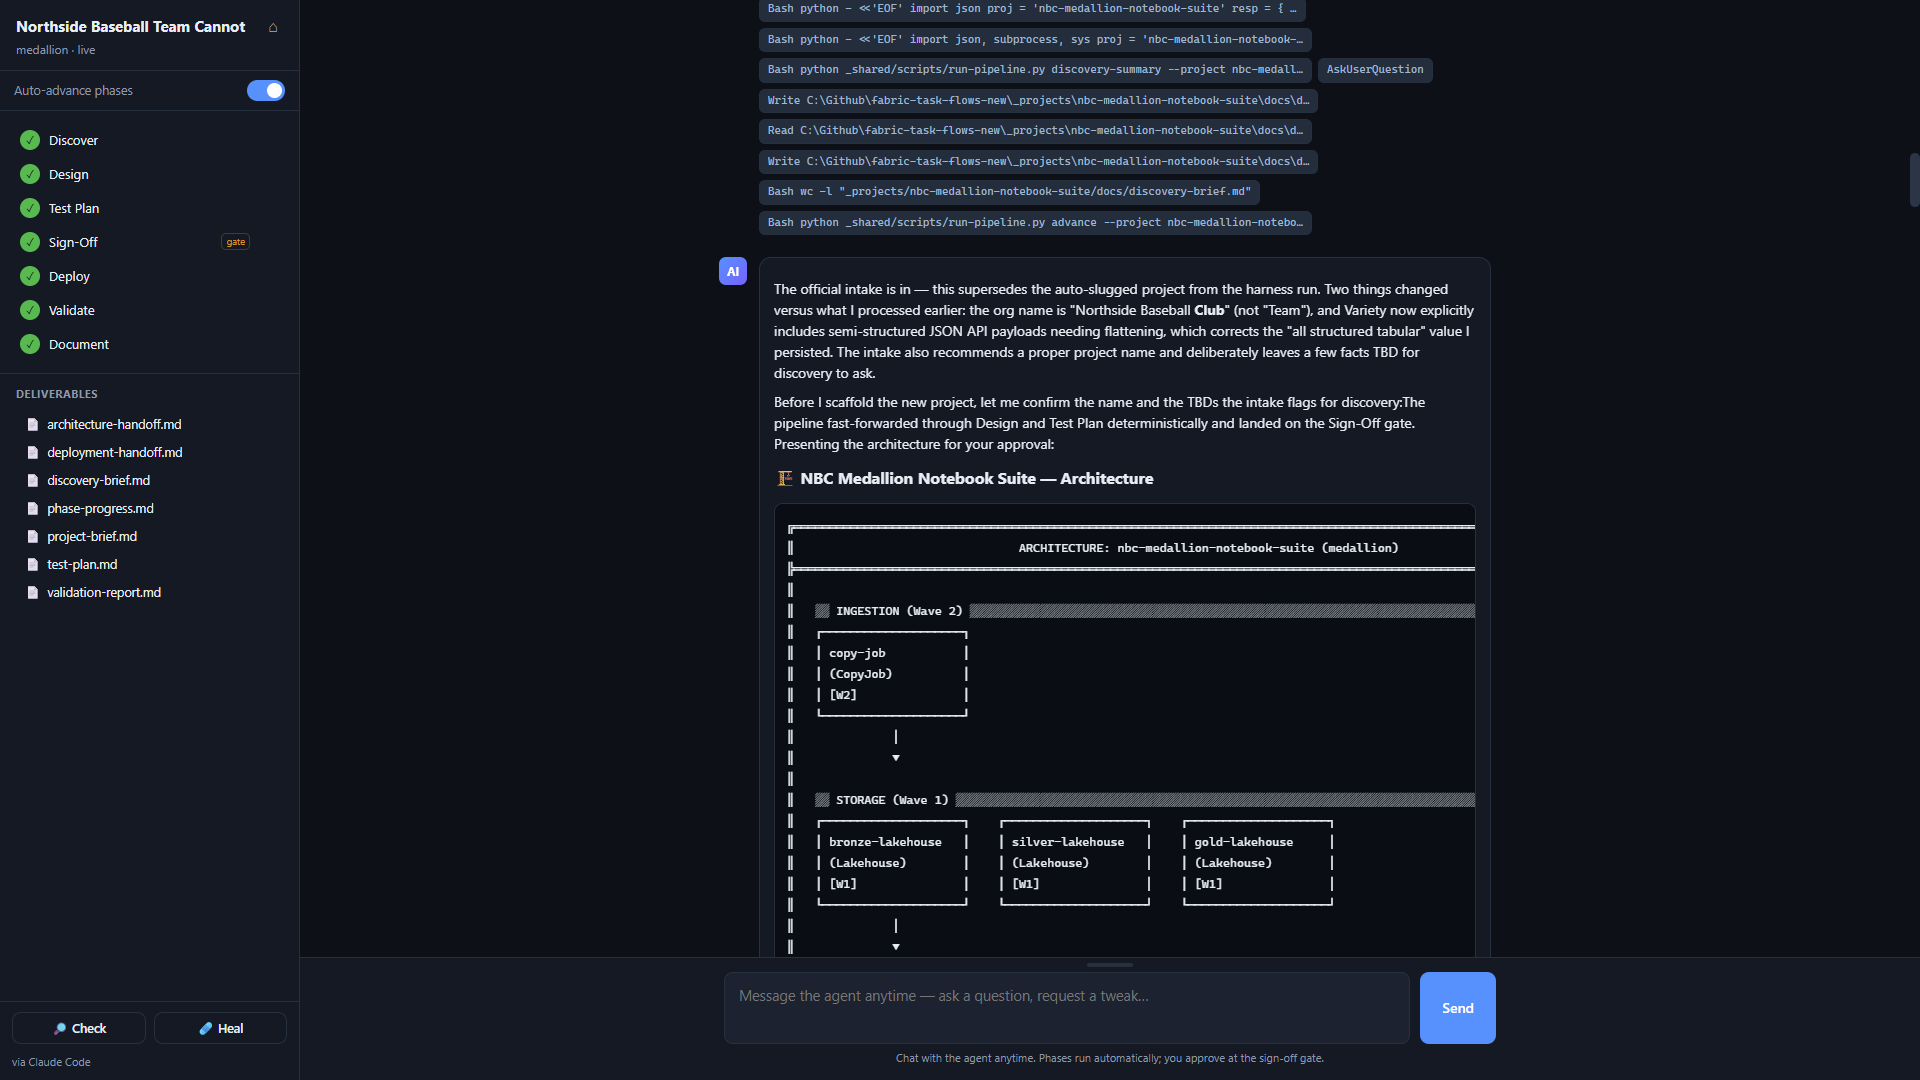
You get the architecture diagram, then a plain-language summary of what is about to happen. Not a decision table, not a wave order. Just what data flows where and what you will be able to do with it when it is done.
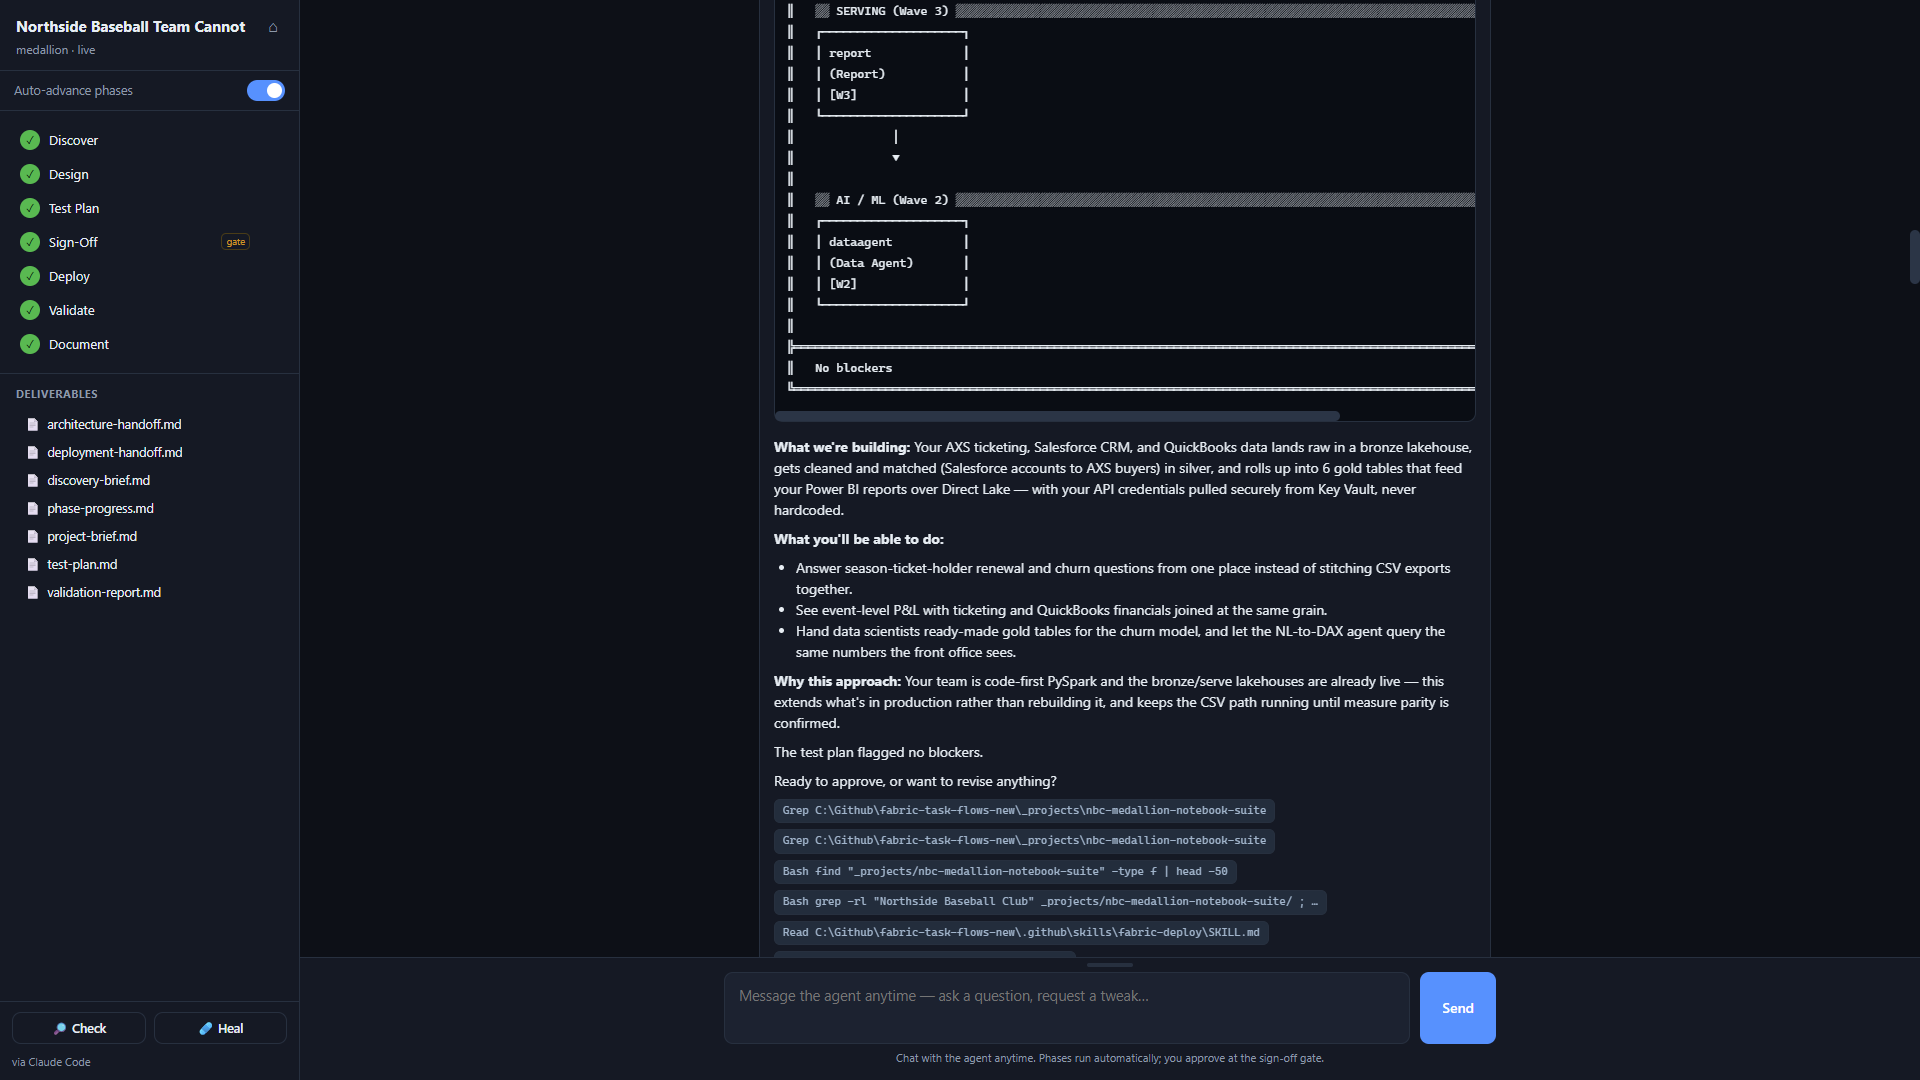
That format is not an accident. It is written into the orchestrator agent’s instructions, which are worth reading in full (they’re in the library) because they tell you exactly how the thing behaves:
## Your Role

Route to the appropriate skill based on pipeline phase.

| Phase | Skill |
|-------|-------|
| 0a Discovery | /fabric-discover |
| 1 Design | /fabric-design |
| 2a Test Plan | /fabric-test |
| 2b Sign-Off | (you handle) |
| 2c Deploy | /fabric-deploy |
| 3 Validate | /fabric-test |
| 4 Document | /fabric-document |

## Human Gate: Phase 2b Sign-Off

The ONLY phase requiring orchestrator action. Your chat response IS the
user's interface.

**Step 2:** Copy the ENTIRE diagram into your response. Do NOT summarize
it, do NOT create your own tree/table, do NOT paraphrase.

**Never show:** decision tables, deployment wave order, alternatives
considered, or trade-offs.

## Guardrails

**You route, you do not teach.**

Speak plain language. Use the user's words ("your Square sales data"),
not jargon ("API-based ingestion"). Don't parrot terminal output.
At the gate you have three options: Approve and deploy live (which needs az login), Approve artifacts only (which generates the CI/CD-ready scripts without touching your tenant), or type feedback and Revise. Revise is worth using. It is not a one-shot prompt, and treating it like one is the most common mistake I see.
There is also an auto-advance toggle on every project. Leave it on and the phases run back-to-back until they hit the gate. Turn it off and the pipeline pauses after each phase so you can read the deliverable and click Continue. Both are fine. On is faster, off gives you more chances to correct course. Use whichever matches how much you trust the run in front of you.
Ask It What It Rejected
Buried at the bottom of architecture-handoff.md is my favorite thing in the whole tool. Alongside the decisions it made, it writes down the ones it did not:
## Alternatives Considered

| # | Decision | Option Rejected | Why Rejected |
|---|----------|-----------------|--------------|
| 1 | Storage | Warehouse | Spark/Python skillset is best served by Lakehouse with Delta Lake and native Spark compute |
| 4 | Ingestion | Eventstream | Code-first team benefits from Pipeline orchestration with Notebook transformations |
| 7 | Ingestion | Dataflow Gen2 | Code-first team benefits from Pipeline orchestration with Notebook transformations |
| 9 | Processing | Spark Job Definition | Notebook is the default for exploratory development and iterative analysis |
When you work agentically with Fabric or Power BI, do not take the output at face value. Reading what it threw away tells you more about whether it understood you than reading what it kept. If it rejected the option you would have picked, you now know exactly which sentence in your brief to fix.
The handoff also carries the item list and the deployment waves as YAML, which is what the deploy phase actually executes against:
waves:
  - id: 1
    name: "Wave 1"
    items: [bronze-lakehouse, silver-lakehouse, gold-lakehouse]
    parallel: true
  - id: 2
    items: [environment, semantic-model, copy-job, dataagent, variablelibrary]
    blocked_by: [1]
    parallel: true
  - id: 3
    items: [notebook, report]
    blocked_by: [2]
    parallel: true
Dependency-ordered, parallel where it can be. That ordering problem I mentioned at the top, the one that eats an afternoon when you do it by hand, is a generated artifact here.
It Can Read What You Already Have
This is the part I get most excited about, and it is the part people do not expect.
The agent is authenticated against your tenant through the Azure CLI, which means it is not designing in a vacuum. It can list your workspaces, check which capacity you are on, and inspect what is already deployed. Before one of my runs went to deploy, it stopped and asked whether it should inspect the lakehouse that already existed in the target workspace. On another, it tried to create a workspace, hit WorkspaceNameAlreadyExists, went and looked at what was in there, and came back with “a prior deploy of this project already completed, here are your options.”
So a project does not have to be greenfield. My second run was the opposite of greenfield: point at the Northside Baseball workspace, find the concessions, CRM, ticketing, and account data already scattered across it, and consolidate it into one true gold lakehouse. No new source systems. Just take what is there and shape it.
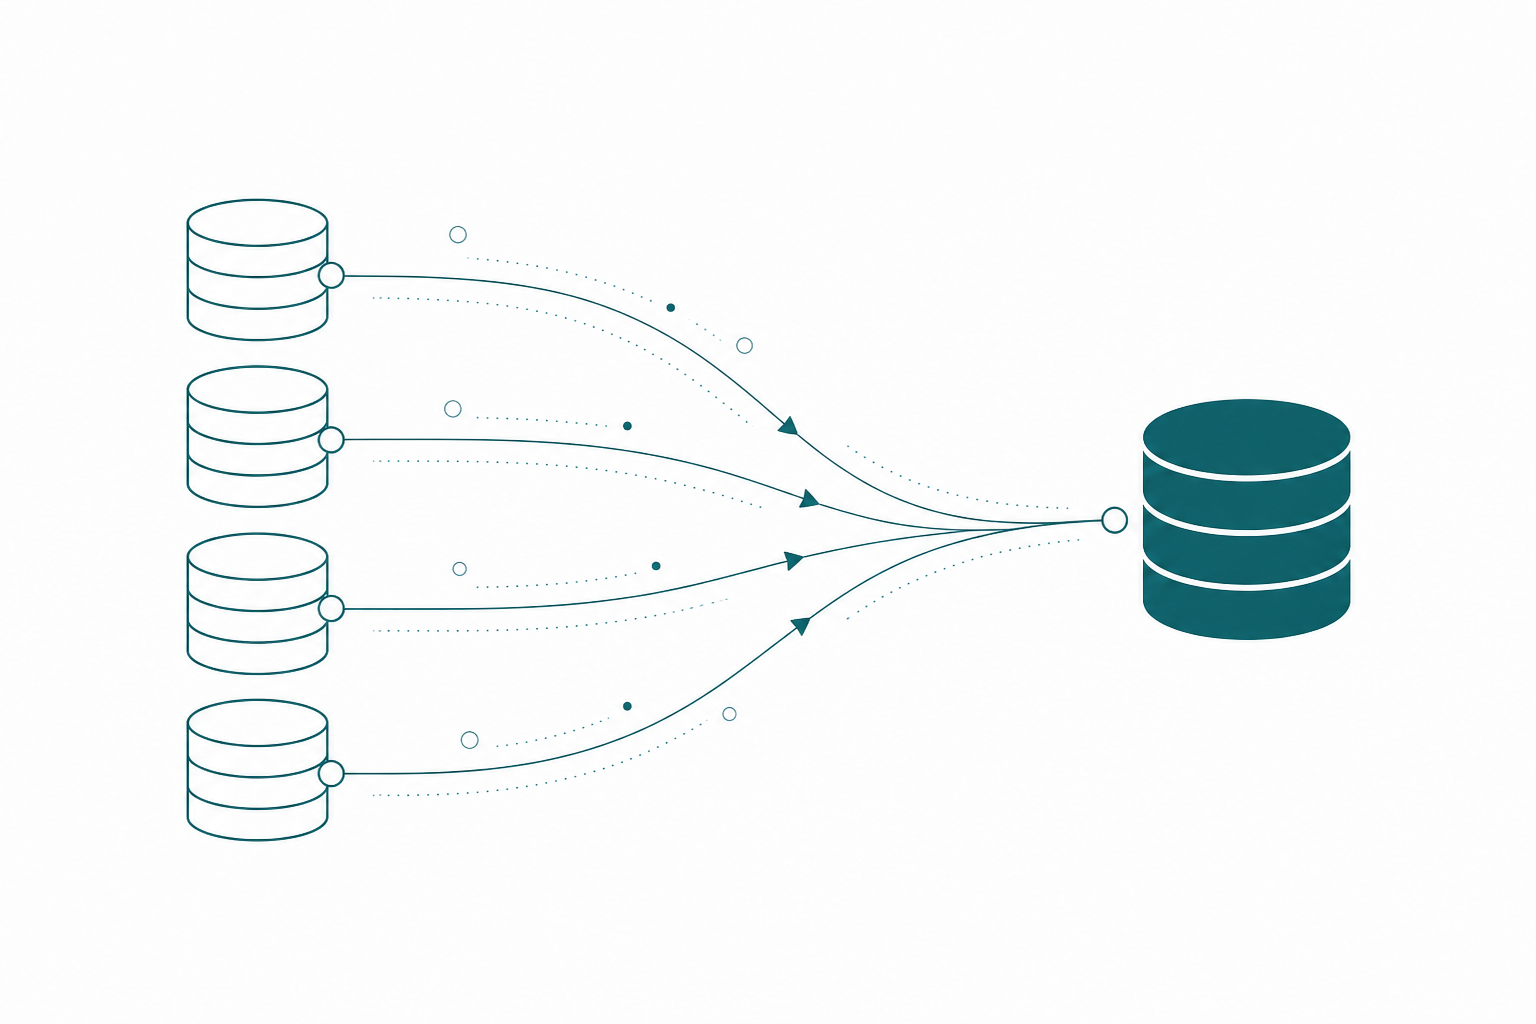
It used OneLake shortcuts rather than copies, which is the right call and not one I had to make. Forty shortcuts, zero failures, verified through the REST API afterward.
Which leads to the other thing worth knowing: once artifacts exist, you can keep using the session to operate them. Run a notebook, kick off a pipeline, trigger a job. The tool was originally built to design and deploy architecture, but because it holds the connection and the project context, it works fine as a control surface afterward. One of my runs finished with a live notebook execution as a smoke test, 2 minutes 8 seconds on the trial capacity, which proved Spark compute worked end to end before anyone claimed victory.
And it is honest about what it cannot prove. From a real validation report: the structural checks all passed, the config checks all passed, and then “query returns data” and “report renders with data” were marked as deferred, because the lakehouses were empty and that is expected for a scaffold deploy, not a defect. I will take that over a green checkmark that means nothing.
Projects, Not Chats
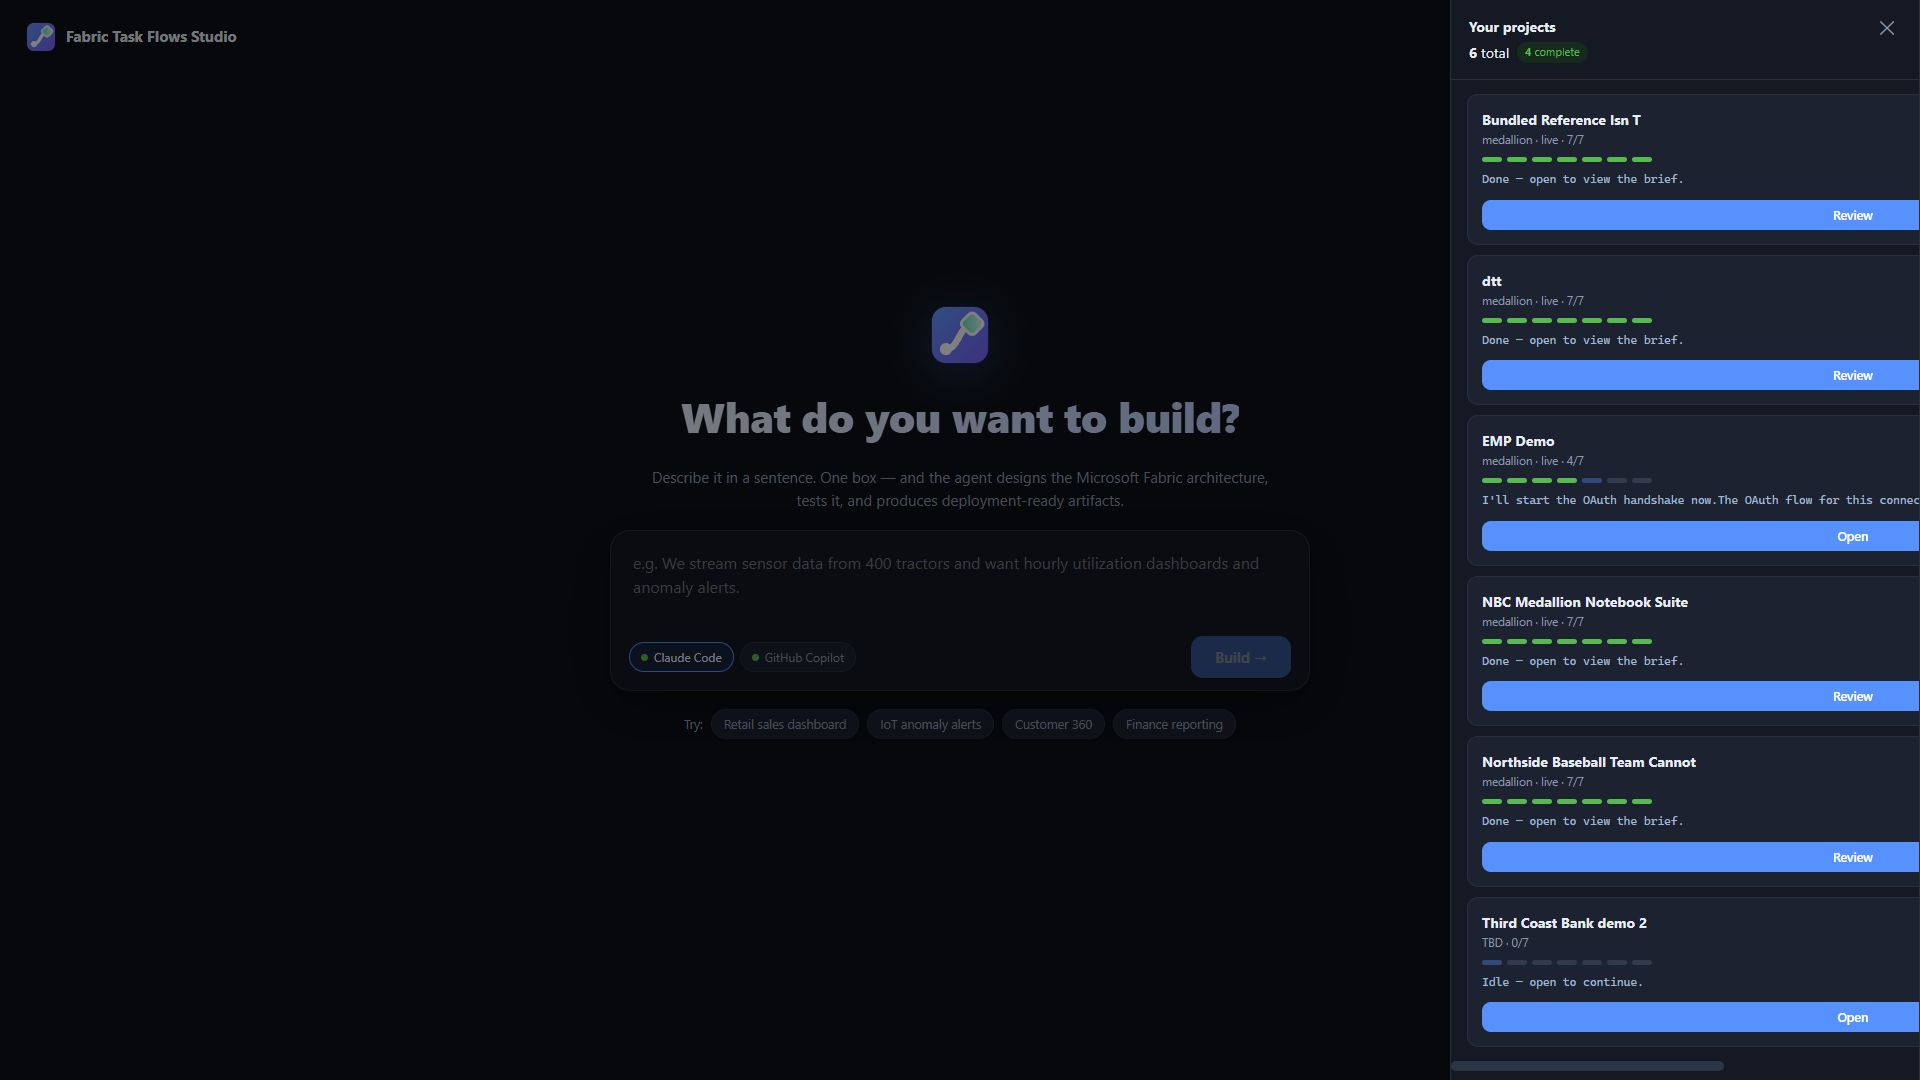
Every run is a project, and this is the part that makes it usable on real work rather than demos.
Everything lands on disk:
_projects/your-project/
├── docs/                  ← discovery, architecture, test plan, validation, brief
├── deploy/                ← CI/CD-ready deployment scripts + workspace definitions
└── .studio/history.jsonl  ← saved chat transcript
A few things fall out of that:
- You can resume anything, anytime. Close the app, reboot the machine, come back in a week. The pipeline state and the transcript are on disk, so reopening the project replays the conversation and picks up at the current phase.
- You can manage projects you already finished. The dashboard is not just a list of active runs. Every project you have ever done is sitting there with its deliverables, and you can reopen one, ask the agent a question about it, or use it as the context for the next round of work on that same architecture. I lean on this constantly.
- You can redo a phase. Hover any phase in the timeline and you get Review, Edit, and Redo. Redo resets that phase and everything after it and runs again. If the test plan is weak, you do not restart the project. You redo the test plan.
- You can edit a deliverable by hand. Open it, edit the markdown inline, save. The agent works from your version.
- Check and Heal. Check verifies every completed phase’s output and state consistency, read-only. Heal reconciles drift from the file evidence. Use Check when something feels off before you blame the agent.
- Run several at once. Each project is an independent session with its own agent process. During the walkthrough I had two going: one building artifacts from nothing, one consolidating existing ones.
The deploy scripts are plain Python. Claude Code is not doing magic to your tenant; it is generating and running scripts you can read, keep, version, and run somewhere else entirely. That is worth knowing the first time you are nervous about pointing this at a client environment.
One current limitation: the app does not take file attachments. If you need to hand it a CSV or an Excel file for a historical backfill, point it at a OneLake path (works great) or drop the file in the project folder and tell it where to look.
Takeaways
- Clone the repo, install Python 3.11+ and one agent CLI, run
az login, double-clickstart.bat. That is the whole setup. Check the API settings in your admin portal first. - Spend your effort on the problem statement, not the prompt. Constraints, exclusions, and who reads the output move the design more than anything else. Write a skill that supplies the ones that never change.
- Read the discovery brief before you let it design. The Source and Confidence columns tell you what it guessed at. Fixing a sentence there is cheaper than revising an architecture later.
- Read Alternatives Considered. What it rejected is the best available evidence that it understood you.
- Auto-advance is a dial, not a setting. On when you trust the run, off when you want to read each deliverable before it compounds.
- Point it at what you already have. Brownfield consolidation into a gold layer is one of the strongest things it does, and it will use shortcuts instead of copies.
- Treat runs as projects. Resume old ones, redo single phases, edit deliverables by hand, and keep using finished projects as the context for the next piece of work on that architecture.
If you hit a wall, open an issue on the repo. I would rather fix it than have you fight it.
And if you are anywhere near Chicago, come out to the Chicagoland Power BI User Group. September 24 is AI harnesses for Fabric, which is the “where does the context come from” companion to this post. October 22 is the Fabric and Power BI MCP servers. November 19 is agentic report design with the Power BI Desktop Bridge. Bring a friend. There is a sandwich in it for you.