
One Visual Was Never the Job
October 16, 2026 · Tommy Puglia
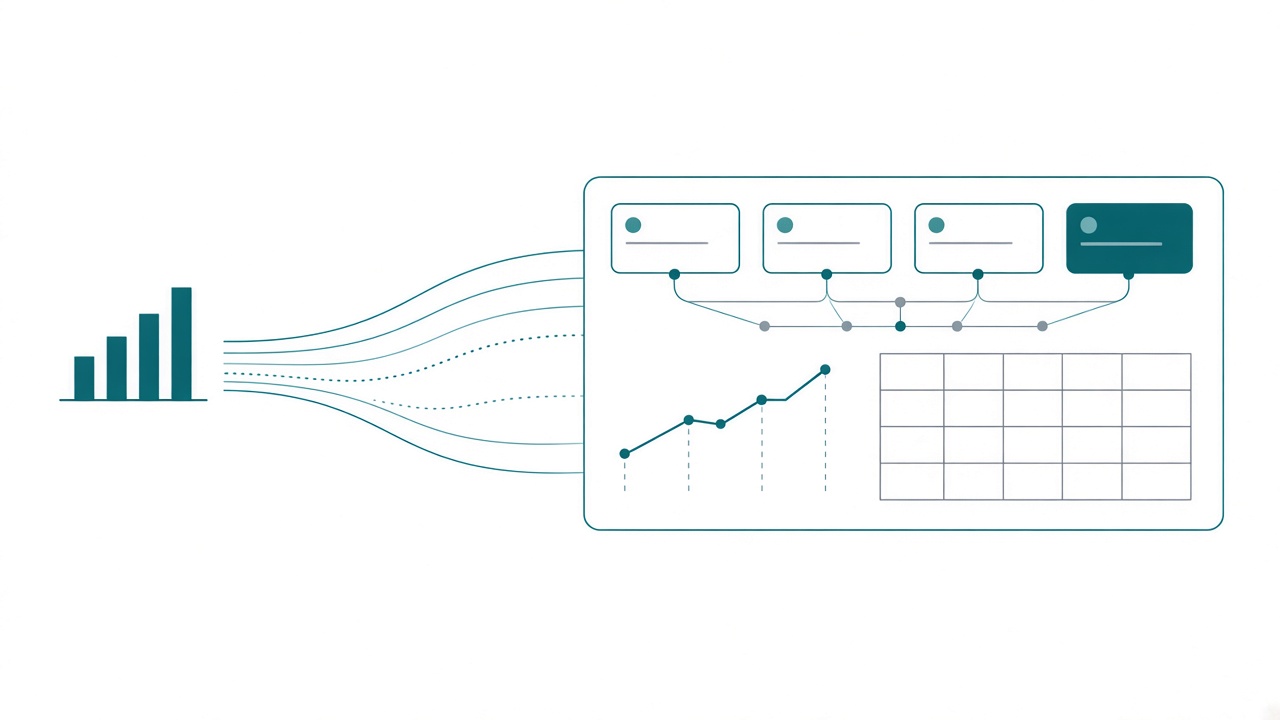
Ask someone who’s excited about AI for data viz to show you what it can do, and you’ll almost always get a chart. One chart. A bar chart out of a spreadsheet, a forecast line out of a notebook. Can AI build the bar chart? Well, of course it can.
I don’t care.
I use these tools every day, and a single chart has never been the job in Power BI. Where AI helps most is the page, where visuals have to work together, and the data each visual needs that your model doesn’t have yet. Then you click everything to prove the page works.
The bar chart is a demo
Rituparna Das wrote a good piece on Nightingale, Three Ways I Actually Use AI in Data Viz, and I’d recommend reading it. She walks through three workflows: Google Sheets with Gemini, a Colab notebook with Gemini, and Tableau with ChatGPT. Her conclusion is that the value of AI in data viz right now is iteration speed. It compresses the time between idea and output.
I agree with her, and that compression is real. Each workflow also ends the same way: one data set, one question, one visual. That fits an article, where the chart is the deliverable. In Power BI it never has been.
I’ve said it for years: no one actually wants a report. It’s just the best medium we have to get people the information they need. The questions I get are whether last night went well, which region is slipping, and whether the campaign deserves another quarter.
A page is a lineup
A chart off a CSV has one table and no context. A Power BI visual sits on a semantic model with relationships, filter context, a dozen measures that sound alike, and four other visuals on the page cross-filtering it. The holy grail is a report in your theme, built against your model, where every visual knows what the others are doing.
Honestly, the visual itself is maybe 30% of what makes a report good. The rest is the data inside it, evaluation context included, and whether the page answers the question it was built for.
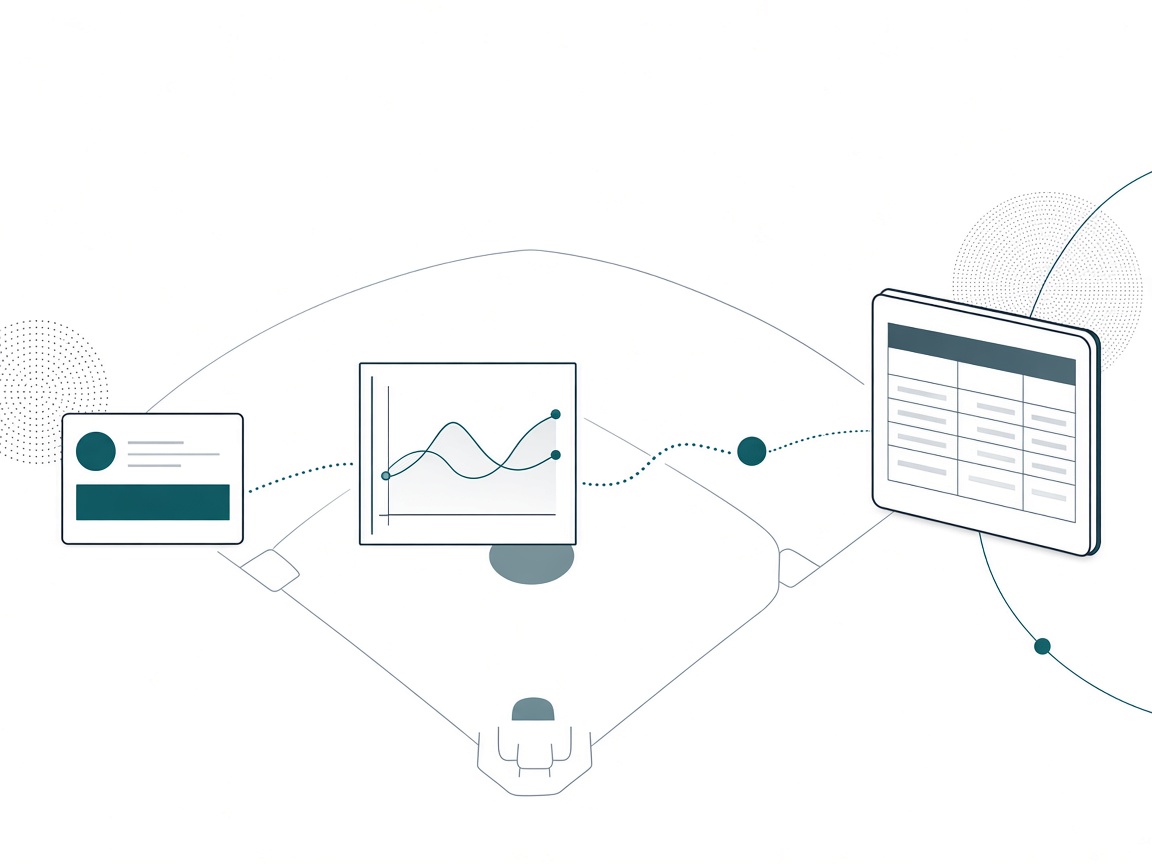
A baseball lineup is built around the order. The leadoff hitter gets on base, the next guy moves him over, and the cleanup hitter drives him in. Sign the nine best home run hitters you can find, bat them in any order, and you’ll hit some bombs and strike out all night. Each hitter is judged by what he sets up for the next one, and a great bat in the wrong slot is a wasted at-bat.
A report page is a lineup. I built a skill around the old test of what someone should get from a page in three seconds, in thirty seconds, and in three minutes. Each of those is a different job, so each one gets a different visual. On a typical page, the KPI strip gets you on base: something is off. The trend moves the runner along: when it started. The detail table drives him home: where, and who. Ask an agent for “a bar chart of revenue by region” and you’ve signed a home run hitter without deciding where he bats.
Notebook charts are for you
When I build visuals in a notebook, or ask Copilot to chart something, I’m almost always building them for myself, for what I need to see right then. That’s exploration, and single-chart AI is perfect for it. Make six charts, throw away five.
A report is different because it lives over time, and our data is almost never static. That’s where storytelling and story framing split. Storytelling is the one-off chart: you mark the dates that matter, annotate the spike, and it’s finished forever. You can’t really do that in Power BI, because next week the spike is somewhere else. Story framing is what a report does. It sets up a structure so that whatever the data does next week, the page still tells the reader where to look.
I learned this with my own Strava cycling data. My first pass was heart rate and speed, because that’s what the data had. It didn’t help at all. What I wanted was to know one thing because of an action I wanted to take next. An agent will happily build you heart rate and speed. You have to know the action to build the other page.
The agent’s best work is the data behind the visual
The biggest benefit I’ve gotten from agentic tooling for data viz is building the data for the visual.
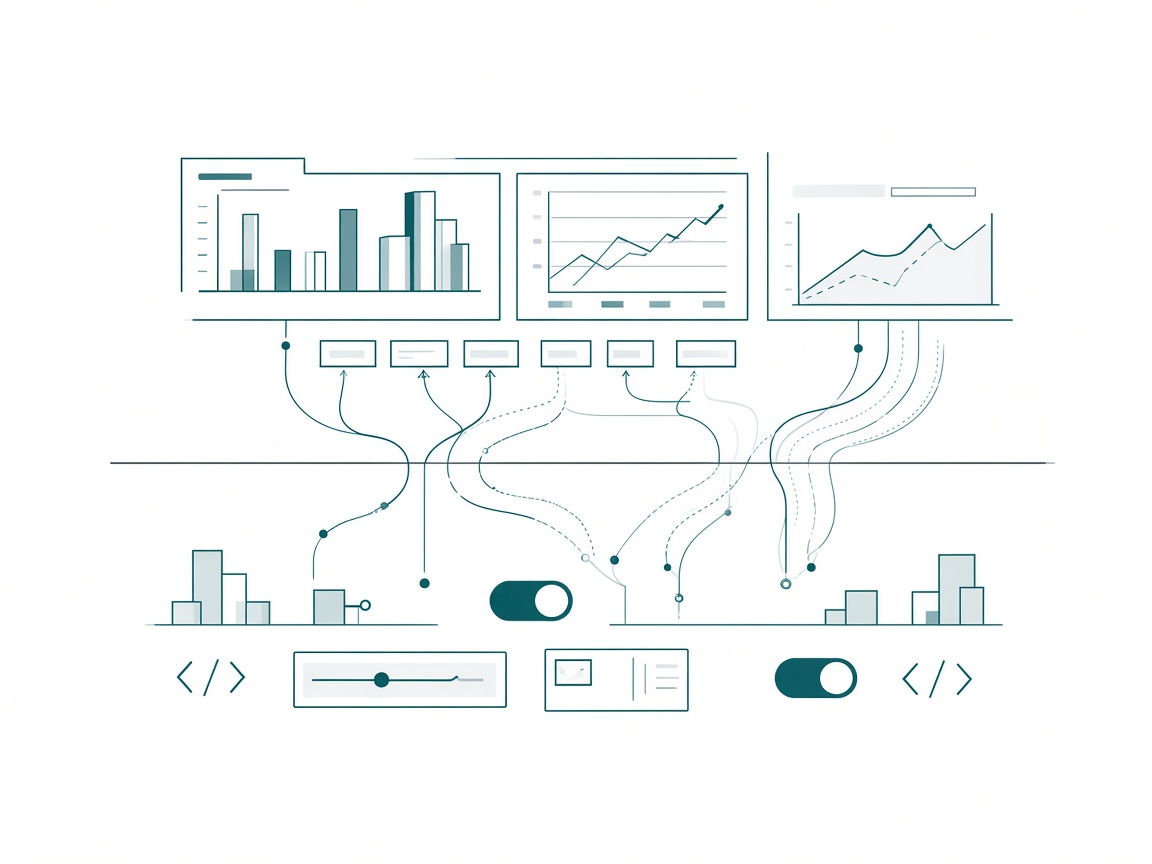
Every report page I ship needs things the semantic model doesn’t have on day one: a disconnected table for a toggle, a what-if parameter, measures that exist only to drive a display. They’re report-specific, sometimes visual-specific, separate from the semantic measures that hold the base number, and tedious to build by hand. With an MCP server or the Power BI Desktop Bridge and the proper context, an agent builds them fast.
Take the Game Day Command Center from my Northside Baseball spec. Here’s what that page needed beyond the base measures:
- A This game / Prior game toggle. A small
Game Offsettable driving tiles in the slicer band. I chose a toggle over a bookmark because a bookmark captures one fixed game and goes stale. - A what-if parameter.
Games Selectedsets how many earlier games the trailing average covers, five by default. A what-if parameter is just a disconnected table plus a measure that reads the selection. - Display measures. The trailing-5 average, drawn as a dashed second line against whichever game is on screen.
- A KPI strip made of SVG. Six DAX measures that each return an image, sitting in a one-row table, because the multi-value card rendered empty on the build I was using.
Every one of those exists so a visual works, and they’re exactly the measures nobody wants to write by hand. On another project, I had the agent clean 25 tables and build the measures, then added one more line: build a bunch of conditional formatting measures, too.
Keep the base number apart from the display. The base number belongs in the model, where every report and every data agent can reach it. A measure that returns an SVG string or a color token was built for a page. Some of those earn a spot in the model because several reports reuse them. Others can live in the report as extension measures. Know the cost: anything defined only in the report is invisible to an agent asking the model questions. (I covered color tokens in the design post.) Decide where each one lives before the agent decides for you.
A conditional formatting measure is also the easiest thing for an agent to write and get wrong. I once put an email open rate in red because it was down 10%. Anything below zero is red, right? Seemed natural. I didn’t know the team had spent six months experimenting with a wider audience, so of course the rate dropped. An agent would have written that measure in two seconds, and it wouldn’t have known either. The threshold is a business decision. The agent just types it.
The last step is the click
When I design with an LLM now, the last thing I do is validation.
The page will look great. Everything lines up, pixel perfect. Then you click a slicer and something is screwy. The total doesn’t move. The trailing average ignores the toggle. One card keeps showing last night no matter what you pick.
Two reasons this happens more with agents than people expect:
- Models agree with you. An LLM will confirm things for you that are not right, and filter context is exactly where a confident wrong answer hides. Humans fall into that trap too. An agent falls into it faster and sounds surer.
- Report properties are ambiguous. The property behind “fill” on a bar chart lives somewhere else on a different visual. The report format is new and there aren’t many public examples for a model to learn from, so the agent guesses, and a wrong guess often renders just fine.
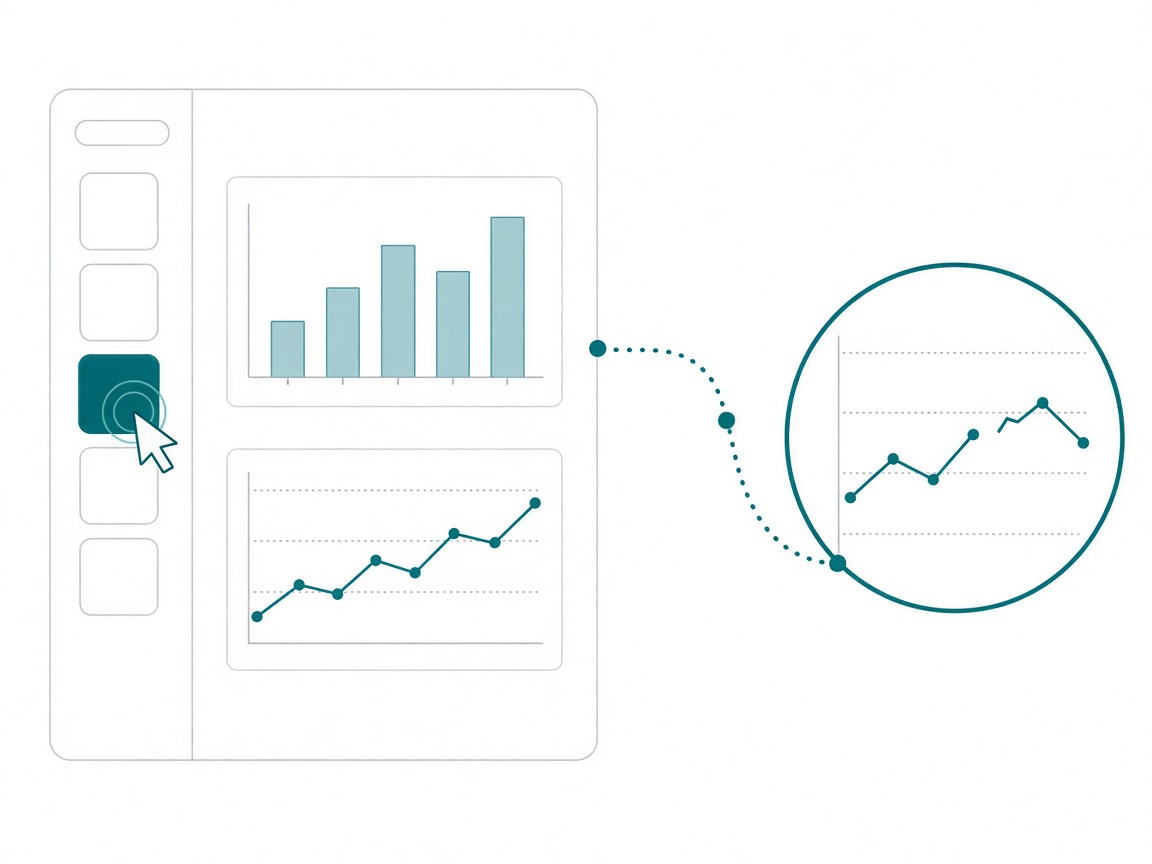
So here’s my rule. The screenshot proves it rendered. The click proves it works. Before anything gets designed, I check that the model returns the row counts I expect. After the page is built, I click every slicer, every toggle, every cross-filter, and check at least one number against a table I trust.
Ask for the page
Here’s how I’d change your next agent session for a report:
- Frame your questions for the agent. In requirements meetings, I phrase clarifying questions so my agentic tools can use the answers later. A note like “which stores are slipping, and since when” gives the agent something to build from.
- Write the lineup. For each page, write what someone should get in three seconds, thirty seconds, and three minutes, and which visual does each job.
- Ask the agent for the data each visual needs. Before any layout, have it list the toggles, what-if parameters, disconnected tables, and display measures this page needs that the model doesn’t have. Put each one in the model if a second report or a data agent needs it, and in the report if only this page does.
- Put it in the spec. Each of those goes in the decisions list with a reason on its row, the way they do in the Northside spec.
- Click before you ship. Every slicer, every toggle, and one number checked against a table you trust.
Takeaways
- AI drawing one chart is real and fast, and it’s the least useful thing it does for a Power BI report.
- A page is a lineup. Ask the agent for the page.
- Notebook charts are for you. Reports live over time, so build them to frame a story the data keeps changing.
- The agent’s best report work is the data behind the visual. Keep display measures apart from base numbers, and remember that report-only measures are invisible to anything querying the model.
- The screenshot proves it rendered. The click proves it works.
Key takeaway: the next time you open an agent session for a report, start by asking it to list the tables and measures each visual on the page needs that your model doesn’t have yet. Build those first, then the visuals.
Drawing the chart is going to be free, if it isn’t already. The people who get the most out of AI in reporting will point it at the page and the measures underneath it, and they’ll click everything before it ships. If you’re working through this on your own reports, keep the conversation going with us on the Explicit Measures podcast, and subscribe at PromptingBI for more.