
Same Prompt, Two Reports: Give Desktop Bridge a Spec Before It Builds
October 2, 2026 · Tommy Puglia
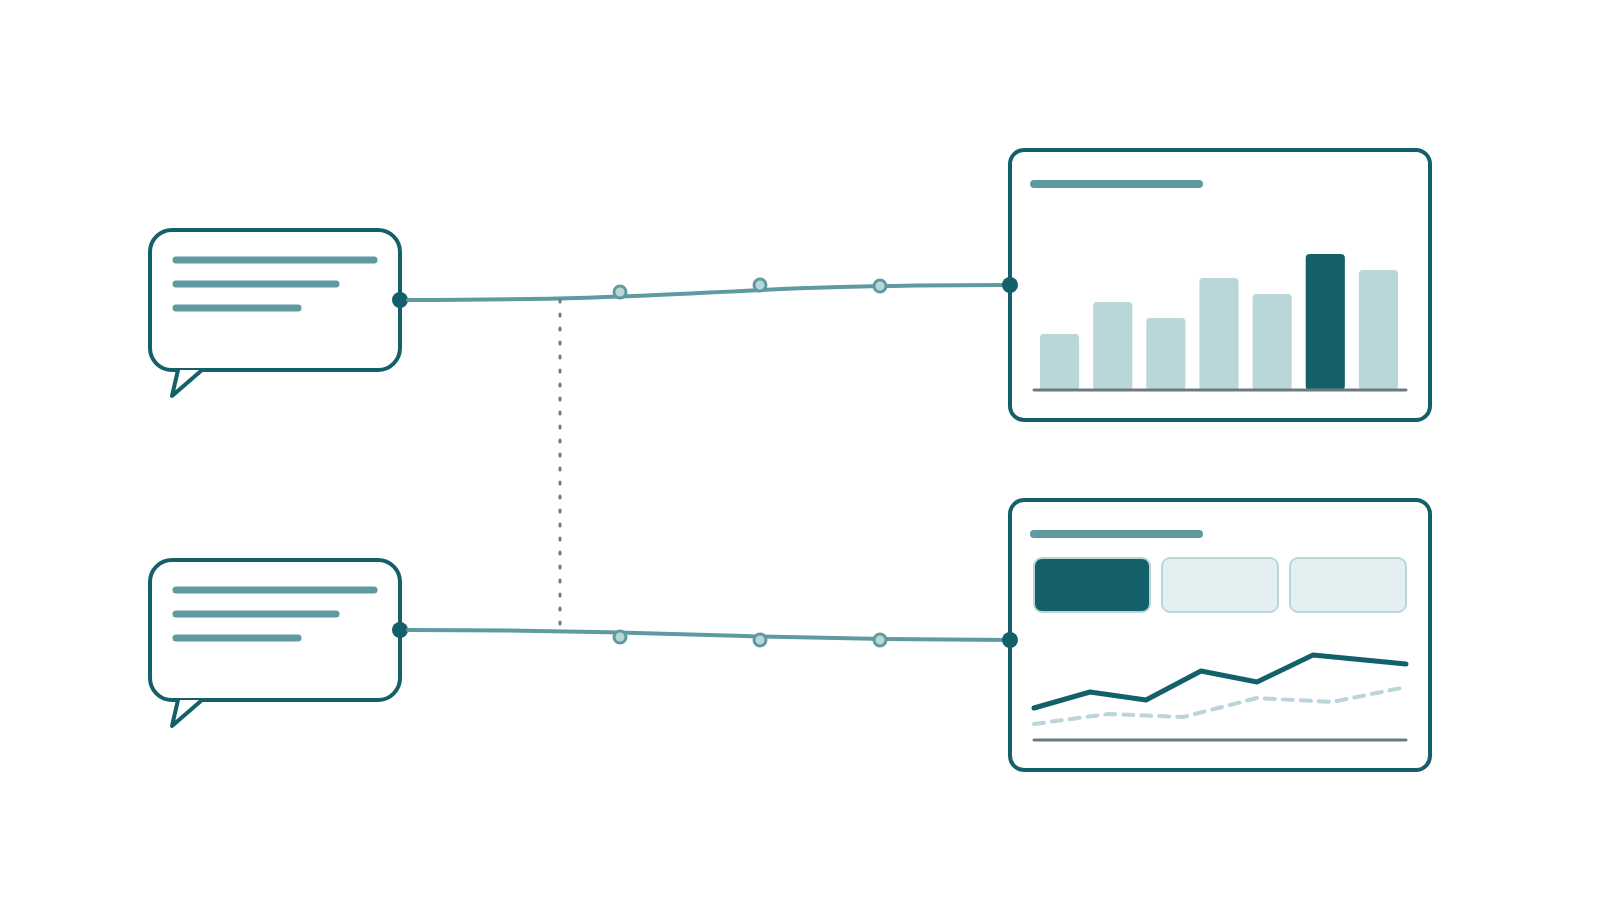
My kids have started doing science experiments, so let’s do one. Open Power BI Desktop with a finished semantic model. Point an agent at it through the Desktop Bridge. Give it a prompt: here are three measures, show them over time, build me a page. Load the report skills, too. Then open a fresh session with the same model, the same agent, and the same prompt, and run it again.
Same inputs, same tools. Do you get the same report?
You don’t. Every time I’ve run this I’ve gotten radically different designs. Both look pretty nice, and that’s what makes it dangerous. Neither one is wrong, exactly. They just don’t match, and nothing in the prompt tells you which one you’re going to get. That doesn’t work for me. I can’t hand a team a process where the design depends on which run they happened to get.
The Bridge is doing its job here. The gap is every decision nobody made before the agent started building. Desktop Bridge only performs like a Ferrari when you add two things: the three Microsoft report skills, used in order, and a kickoff that comes from somewhere other than the chat box.
Run the Experiment Before You Argue With Me
Treat it like a real experiment and hold your controls fixed:
- Same model. Same file, same measures, nothing refreshed between runs.
- Same prompt. Copy and paste it. Don’t retype it.
- Same skills loaded. If you load the report skills for run A, load them for run B.
- Fresh session each time. No leftover context from the first run.
Then compare what came back. Look at which measures made the page, which chart types the agent picked, where the slicers went, how “over time” got interpreted (month? week? season?), and what the page title says. Ignore pixel-level differences. The check is whether the two runs built the same report: the same visuals answering the same questions.
A typical “measure list plus show it over time” prompt fails that check. Can an agent design a full page from one sentence? Well, of course it can. Just because it can doesn’t mean the page is good, or worth shipping, and it definitely doesn’t mean you’ll get that page again tomorrow.
What the Bridge Actually Controls
Before blaming the tool, it helps to be precise about what the tool is, because most of the confusion I see starts here.
The Desktop Bridge is a feature of Power BI Desktop. Inside Desktop it isn’t even labeled “Desktop Bridge.” You turn it on under preview features as “Enable external tool access to Power BI Desktop through secure local APIs.” That switch starts a local server inside the Desktop process, reachable only from your own machine. The CLI (@microsoft/powerbi-desktop-bridge-cli, which gives you the powerbi-desktop command) is a separate package you install so your agent has ready-made commands for talking to that server. You don’t strictly need the CLI, but it’s the most direct way in, and an agent you ask to set up the Bridge will almost certainly reach for it.
The surface is small. There’s a manifest call to discover what’s supported, an application state call that tells you which file is open and whether it has unsaved changes, a reload from disk, and a screenshot of a page. Everything else is your agent editing PBIR files on disk. (I walked through the full reload and screenshot loop in an earlier post.)
Microsoft’s own tooling splits the work cleanly. The Power BI Modeling MCP server is for the semantic model. The Desktop Bridge is for report authoring, and the docs file it under the agent skills for report authoring. That placement says Microsoft expects the skills to drive the Bridge.
Here’s the part that matters for the experiment: the Bridge decides nothing. It reloads and it takes a picture. It doesn’t choose your measures, your layout, your chart types, or your palette. Every one of those choices gets made by the agent, unless you already made it.
One mechanic does bite people, so know it before you start. Desktop holds edits in memory until you save, and Save writes that in-memory copy over the report files on disk. You can lose work two ways. Edit by hand, don’t save, let the agent reload, and your manual changes are gone. Or hit Ctrl+S after the agent writes its files but before the reload, and Desktop silently rolls back everything the agent just wrote. That’s why the application state check exists, and why my Bridge instructions fix the order: save your own changes first, let the agent write, then reload and screenshot with no save in between.
Every Open Decision Is a Coin Flip
Walk into the same trattoria two nights in a row and order “pasta, something with tomatoes.” Night one you get a beautiful amatriciana. Night two you get penne alla vodka. Both are great. The kitchen did exactly what you asked, and the order left a dozen decisions open: the shape, the sauce, the heat, the portion. If you want the same plate twice, you order the dish by name.
A report prompt works the same way. Let’s take a project. We’ll call it Northside Baseball. Its ticketing model has 25 measures. Count the decisions a two-sentence prompt against that model leaves open:
- Which measures. “Show revenue” matches several of them: gross revenue, this game, prior game, season to date.
- What the page is for. Executive summary? Analytical canvas? A morning-after recap?
- What “over time” means. Game, month, season, trailing window.
- Chart choice for each of those.
- Layout. Where the KPIs sit, where the slicers go, what gets the hero spot.
- Palette and formatting.
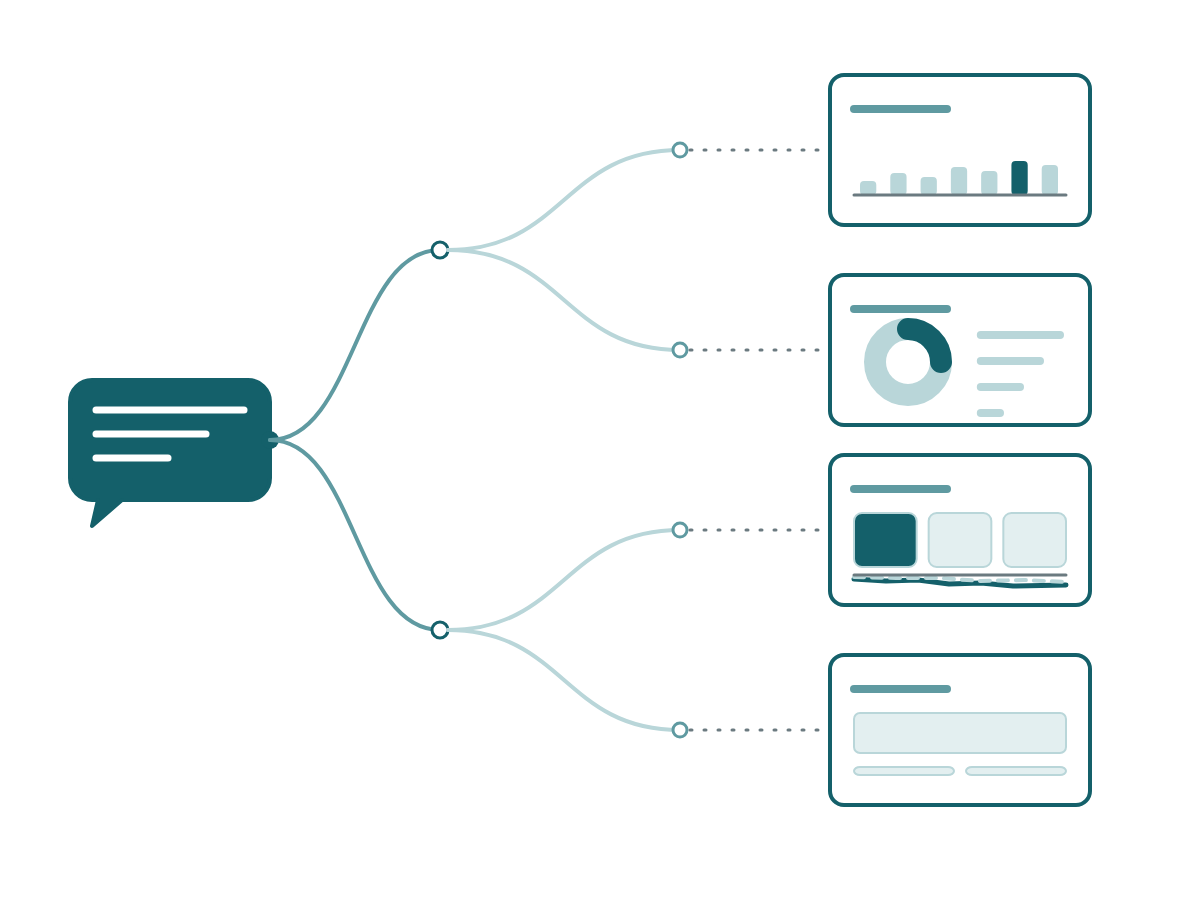
Every one of those is a coin flip. Flip six coins twice and the odds of matching on all six are one in sixty-four, and that’s the generous version, because most of these decisions have far more than two sides. A measure list only tells the agent what’s POSSIBLE. Everything else, the agent picks fresh each run.
Ingredient One: The Three Skills, In Order
The Power BI authoring plugin has three report skills, and I would not dream of starting a Bridge session without them. Most people load them and let the agent pick whichever one seems relevant. The value comes from running them as a sequence, because each one closes a set of decisions before the next one starts.
powerbi-report-planning closes the scope. It gathers requirements and locks a spec before anything gets built. It asks focused questions one at a time, inspects the semantic model, writes a single _brief/report-spec.md, and then stops at an approval gate. It won’t touch a file until you say yes.
powerbi-report-design closes the layout. Page archetypes, chart selection, palette. The output is a Design Brief: YAML block with a layout_contract for every page: the canvas, the grid regions, where each visual is placed, and a space_audit that accounts for empty space. The planning skill won’t ask for approval until that block exists, has no placeholders, and gives every page a title.
powerbi-report-authoring executes the contract. It does the PBIR mechanics, validates, then reloads and screenshots through the Bridge so it can verify what actually rendered.
Read the planning skill’s own rules and you’ll find the line that explains this whole post: if the prose and the embedded YAML disagree, fix the spec before building, and don’t ask the authoring agent to choose between conflicting instructions. Microsoft built the skills so that by the time an agent is writing files, there’s nothing left to choose.
Compare that to the experiment. In the two-sentence version, the authoring step makes every decision on the fly, so the decisions come out different each run. In the sequenced version, they were settled two steps earlier and written down.
Ingredient Two: The Kickoff Comes From Somewhere Else
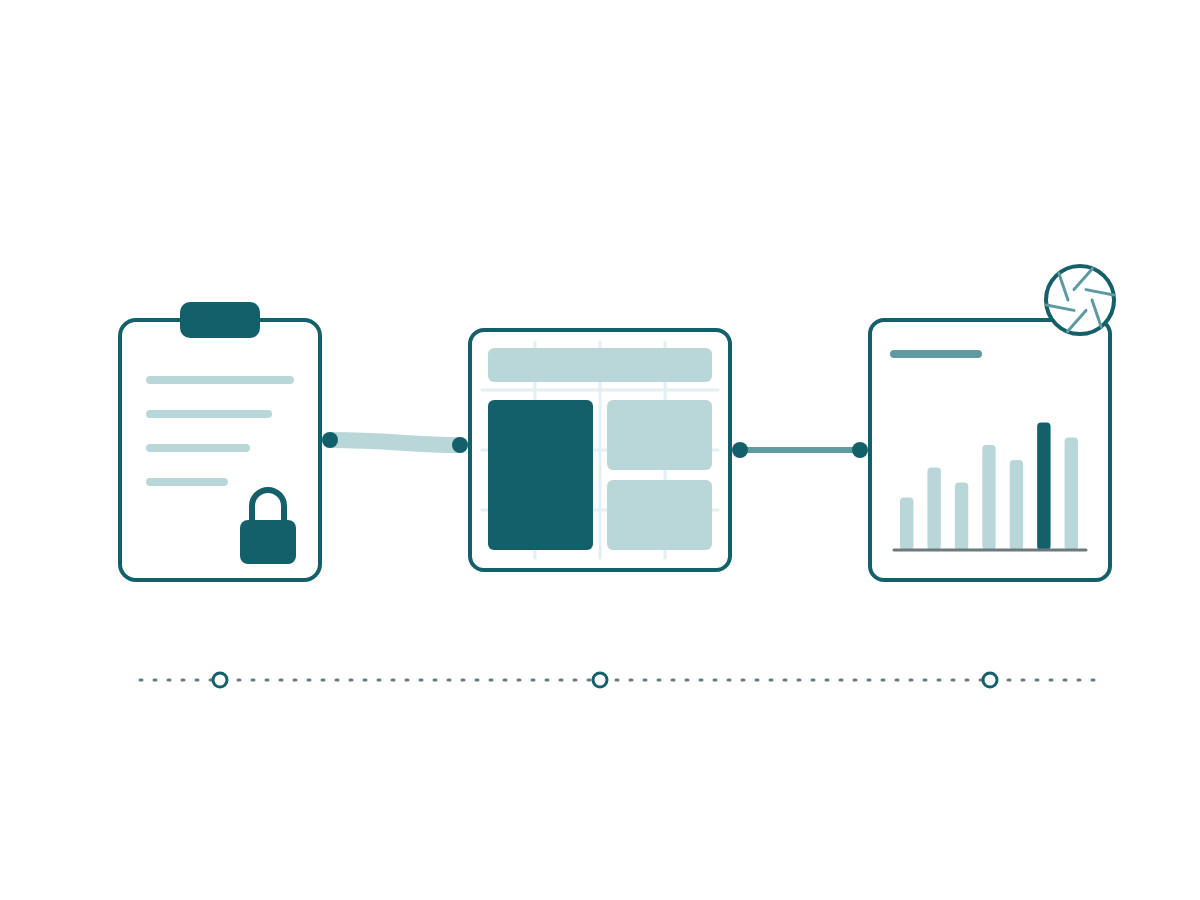
Here’s where I’d push back a little on the “just talk to it” crowd. Refinements can be short. “Make that a line chart.” “Move the slicers to the top.” That’s fine. But I can’t imagine starting a Bridge session with a sentence or two. When I start a session, the instructions were built somewhere else, in another tool I set up for exactly that job. (That split is what I mean by the context harness and the execution harness.)
That matters even more with the skills. The planning skill wants to interview you, one question at a time, across a few rounds. You can sit through that interview every session. Or you can hand it a page where the interview is already answered.
Back to Northside. The instructions there come in two layers: one standing page for every Bridge session, and one page per report.
The standing Desktop Bridge page
This is the page every report session reads first, no matter which report it’s building. It defines the job, the tools, the loop, and the lessons I don’t want to relearn. Here’s a slice of the real one:
## Purpose
You are a report design agent. Your job is to design, build, and
iterate on Power BI report pages for the Northside Baseball Club
dashboards using the Power BI Desktop Bridge and the Report
Authoring Skill.

You have three tools:
- Power BI Desktop Bridge: reload Desktop, capture screenshots,
  check application state
- Report Authoring Skill: read and write PBIR report definition
  files (pages, visuals, formatting, themes)
- Notion MCP Server: read semantic model state and requirements

## Session workflow
1. Read Notion pages: the data dictionary and the semantic model
   build page, so you know which columns and measures exist.
2. Check Desktop state: application.state.get/v1. File open,
   no unsaved changes.
3. Review current pages: screenshot-all.
4. Design/edit: create or modify PBIR page and visual definitions.
5. Reload: file.reload/v1.
6. Screenshot: report.snapshot.capture/v1 for modified pages.
7. Validate: visual quality, data accuracy, layout.
8. Iterate: repeat steps 4-7 until the page meets requirements.
9. Write back: update status on this page and the master
   sequence page.

## Critical warnings (learned on earlier engagements)
3. Multi-value cardVisual renders EMPTY in current Desktop builds.
   Use a one-row tableEx strip for KPI rows.
7. Never Save in Desktop between an agent file write-back and the
   verify run. Desktop's Save overwrites the definition folder on
   disk with its in-memory copy and silently rolls back staged
   changes.
Notice what this page doesn’t do: it never says what to build. It names one skill, authoring, because authoring is the only one every session needs. It has no opinion about which measures go on which page. That’s the job of the second layer.
(I showed the top of this page and its agent flow diagram as screenshots in the context harness post.)
The page for one report
Each report gets its own instruction page, and the first thing it tells the agent to read is the standing Bridge page above. The next report on the Northside board is a Game Day Command Center: one game, not the season, for the GM and the ops director the morning after. Here’s a slice of its page, trimmed to the report skills (the full page also lists the modeling, SVG, and notebook skills for the model work):
## Brief
B-06 · Game Day Command Center · report
Audience: the GM and the ops director, the morning after a game.
They want to know how last night went compared with a normal night.

## Read first
1. Master Sequence
2. Desktop Bridge & Report Design: Bridge workflow, PBIR rules,
   critical warnings

## Skills to invoke
powerbi-report-planning   Lock the page plan (approved below).    Step 5
powerbi-report-design     Design Brief YAML, layout_contract      Step 5
                          per page.
powerbi-report-authoring  PBIR edits, validate, Desktop reload    Steps 6-12
                          and screenshot loop.

This page's project rules override skill defaults.

## Build steps
5. Plan and design. With powerbi-report-planning and powerbi-report-design,
   turn the page plan into a Design Brief YAML block (one layout_contract
   per page, a page title placement, a slicer band, a space_audit).
   This page is the approved spec; don't reopen scope.
6. Game Summary page. Author the PBIR → validate → reload → screenshot.
7. Arrival & Flow page. Same loop.
The report work starts at step 5 because steps 1 through 4 are model prep: checking source columns, building an arrival table, adding shortcuts, and adding the tables and measures this report needs. By the time the skills run, the model already has everything the page plan binds to.
Look at what that does to the skills. The planning skill still runs, but it has nothing left to ask, because the scope is on the page and it’s marked approved. The design skill still produces its contract, from a page plan that already exists. “Don’t reopen scope” is the most important sentence on the page.
The page also records the decisions an agent would otherwise make on its own, along with the reason for each one:
## Decisions
D4  Arrival anchor
    Choice: minutes after gate open, 15-minute buckets.
    Why: the data has no first-pitch time.

D6  "Prior game"
    Choice: a This game / Prior game toggle, not a bookmark.
    Why: a bookmark captures a fixed game and goes stale.

D8  KPI strip
    Choice: one-row tableEx with 6 SVG images, about 140 px tall.
    Why: multi-value cardVisual can render empty on current builds.
Every entry on that list is a coin flip that no longer happens. D8 especially. Left alone, an agent reaches for the card visual when it sees a KPI row, and on the build I was using it rendered blank. I learned that one from a screenshot, and it went into the standing page’s warnings. The report page repeats it as a decision, so this agent never has to pick.
A few names in that block need decoding. tableEx is PBIR’s name for the table visual and cardVisual is the newer card. The KPI “images” are SVG cards drawn by DAX measures, six of them sitting in a one-row table.
And then the page plan itself, visual by visual:
## Page plan (approved content)
GD – Game Summary
  Title textbox bound to GD Event Label.
  Slicer band: event slicer (single-select), Game Offset tiles,
  Games Selected.
  Row 1: one-row SVG KPI strip (6 images).
  Row 2 left: context card (weather, temperature, promo, weekday).
  Row 2 right: waterfall, P&L line × GD P&L Amount,
  total = Operating Income.

GD – Arrival & Flow
  Line chart: arrival bucket × GD Arrival Scans,
  trailing-5 average as a dashed second line.
  Below: cumulative arrival %.
Same decoding pass. Every GD measure is scoped to the one game on screen, the latest by default. Game Offset is the This game / Prior game toggle from D6. Games Selected is a what-if parameter that sets how many earlier games the trailing average covers, five unless someone changes it. The waterfall puts each P&L line (ticket revenue, food, staffing, overhead) on the axis and lands on operating income.
Is that a lot of work before the agent builds anything? Yes. That’s the point. Most of the effort goes into this page, not the session. I don’t write these pages from scratch anymore, either. Polpette puts together the brief, my Fabric advisor agent writes the technical body, and the page goes through a review round before it’s marked ready. My part is the decisions, and when I’m not sure of one, I let an agent grill me until it’s settled.
By the time the Bridge session starts, the kickoff is the same one line I always use: look at the master sequence, confirm we’re on the same page, start on the active item. The master sequence points at this report page, the report page points at the Bridge page, and the agent picks up at step 5. Run the experiment against that stack and both runs execute the same spec.
Rerun It, This Time With Controls
Here’s the version of the experiment worth doing on your own work this week:
- Run the bad version once on purpose. Same model, same two-sentence prompt, two fresh sessions. Screenshot both pages and put them side by side. That image is the best argument you’ll ever make to your team.
- List every difference between the two pages. Measures, chart types, layout, grain, title. Each difference is a decision nobody made.
- Split your instructions into two layers. A standing Bridge page for what every session needs: the role, the tools, the save order, the warnings. A page per report for what this report needs: audience and purpose, a decisions list with a reason on every row, and a page plan that names each visual and its fields.
- Name the skills and their order on the report page. Planning, then design, then authoring, with the step each one owns. Add “don’t reopen scope.”
- Make the kickoff one line that points at the page. Keep your short prompts for refinements.
- Run it twice again. If the two runs still disagree on what’s on the page, find the open decision and add a row. If they only disagree on spacing, fix it with a one-line refinement.
Takeaways
- The same prompt with the same model and the same skills gives you a different report each run. Test it yourself before you trust a two-sentence workflow.
- The Desktop Bridge is a local server inside Desktop that reloads and takes screenshots. It decides nothing. Every design choice is the agent’s unless you’ve already made it.
- Every decision your prompt leaves open is a coin flip: measures, page purpose, time grain, chart choice, layout, palette.
- Run the three report skills as a sequence. Planning locks the spec, design produces a layout contract, and authoring executes it with nothing left to choose.
- Keep two layers of instructions: a standing Bridge page for the tools, loop, and warnings, and a report page for the decisions and the page plan.
- Refinements can be one line. Kickoffs can’t.
Key takeaway: this week, run the same report prompt twice in two fresh sessions and list every difference between the pages. Each one is a decision you should make and write down before the agent gets to make it.
Agents can design report pages now, and that part isn’t going back in the box. The practitioners who get real value from it will be the ones who write the spec before they open the session. If you’re setting this up for your own team, keep the conversation going with us on the Explicit Measures podcast, and subscribe at PromptingBI for more.